Use standard BW functionality to show end users the accurate last load date and time for each report. This saves time for end users, who can see at a glance whether or not they need the report information.
Key Concept
A class is a type of ABAP program. In the context of my solution, I use the class to change the cell contents of the results table. More specifically, the class changes the cell content of the status characteristic. Instead of displaying the key code from the status ODS object, the table interface passes an image string that converts to an icon in the Web application.
In my example, BW creates a report to display the characteristic value as a traffic light icon (for example, a green traffic light instead of displaying the number 10). This helps the end users visualize the data in a more intuitive way.
End users at my company often ask, “How recent is the data that I see in my report?” They want to know when BW extracted data from its source systems. If you have developed Web-based reports, you may have seen the “status of data” information that you can include as part of a text element Web item.
However, this information has a number of limitations. First, users only see the information after they access the report. If you have not loaded the data into BW since the users last looked at the report, they can’t realize it until they’ve spent time to open the report. Secondly, complex BW system architecture involving ODS objects, InfoCubes, and MultiProviders can make the SAP standard “status of data” option misleading.
For example, a MultiProvider can have many different InfoCubes from which it can access data. A BEx query built on this MultiProvider might only access data from some of these underlying InfoCubes. The SAP standard “status of data” information displays the date/time of the underlying InfoCube loaded the longest time ago. For example, InfoCube A was loaded on January 1, 2005, at 9:00, InfoCube B on January 9, 2005, at 7:00, and InfoCube C on January 9, 2005, at 9:00. Because InfoCube A contains no key figures for this BEx query, but is part of the MultiCube, the date and time that the user sees are incorrect (Figure 1).

Figure 1
In this MultiCube, the date and time that the user sees are incorrect
I’m going to show you how to provide end users with an accurate last load date and time for the information that each report contains. End users see a single status report listing all BI reports, along with the corresponding last load date and time. If your business has defined KPIs (e.g., a report loaded daily), you can even display a traffic light status for those particular reports. Both end users and BW system administrators can use this status to quickly identify where problems lie in the system and what reports those problems impact. The solution leverages standard BW technology and works for BW Release 3.0 and up, including SAP NetWeaver 2004s.
Key Components
The solution involves five key components. Other elements of the solution include flat files, master data, and request tables (Figure 2).
- A mapping ODS object that you load with the mapping of reports to data targets (such as ODS objects, InfoCubes, or InfoObjects). The ODS object also contains the command that BW should update these data targets, as well as some other technical information.
- A BEx-enabled ODS object that takes data from the mapping ODS object and determines the true last load date and time by reading the standard, SAP request monitor tables. This is the so-called status ODS object.
- Some ABAP coding that updates rules into the status ODS object. This ABAP coding determines a number of interesting status codes such as loaded on time, not loaded on time, and monitor status. (SAP documentation also refers to monitor status as QM status, status of request, and status in the monitor.) Although end users cannot see these codes, BW administrators can display them to help resolve problems that impact the availability of reports.
- A BEx query that presents the data the mapping ODS object stores.
- A Web template that calls the table interface to present a traffic light icon based on the report’s status.

Figure 2
Key components of the BI report availability solution
The end users see an output as shown in Figure 3. Remember, you decide how much or little of this information you want to show in the end report. I’ll show you how to create two different versions of the Web template, an expert version for BW administrators (showing the technical information relating to a report status), and a standard version (showing only a date/time and traffic light) for the wider user community. You can follow the same steps for both versions, except the standard version requires one additional step.

Figure 3
Status of data report
Mapping Exercise
I will take you through these steps in more detail. Before starting on the system development, you should do the following:
- Make a list of all the reports you would like to output in the final status report
- Analyze and record the data flows that supply data to each of these reports
I recommend that you record these data flows in Microsoft Excel as Table 1 shows.
| Daily Sales Report |
InfoCube B |
Comm Structure x |
C |
24 |
| Daily Sales Report |
InfoCube C |
Comm Structure y |
C |
24 |
| Daily Sales Report |
ODS Object Q |
Comm Structure z |
O |
24 |
|
| Table 1 |
Record the data flow. Numbers in the top row indicate the maximum size of that field in the flat file. |
The Data load frequency column should contain a number that shows how often to update the data target. This is a frequency in hours. If BW should update the data target daily, the value is 24. If it should update the data target weekly, enter a value of 168. Be sure to include all relevant data targets for each report in the file.
Remember that the data target column should only contain true data targets (objects physically loaded with data) and not other InfoProviders, such as MultiProviders or InfoSets. For example, if you build a report on a MultiProvider, you only need to include the relevant data targets in that MultiProvider (not the actual MultiProvider itself).
You also should include all data targets relevant in a data flow that is supplying data to a report. Figure 4 illustrates a possible data flow scenario in which BW reports an accurate last load date, time, and status for a BEx query. In this example, the BEx query’s technical name is YQUERY1. The corresponding mapping file must contain at least one entry in the report column for YQUERY1.

Figure
Mapping for report availability solution
Three different data targets are involved in the data flow pertaining to YQUERY1. These data targets are two basic InfoCubes and one ODS object. The InfoCube’s technical names are YINFO1 and YINFO2. Both InfoCubes have their own update rules. More specifically, the ODS object YODS1 feeds YINFO1, and the communication structure YCOMM2 feeds YINFO2 directly. You therefore must add two entries to the corresponding mapping file for these two InfoCube updates. You can see these two entries on the last two lines of the corresponding mapping.
Note that the technical name for the communication structure, which loads InfoCube YINFO1 is 8YODS1 (i.e., the technical name of the source ODS object prefixed with an 8). You must include an entry in the corresponding mapping file for the data loaded into ODS object ODS 1 (technical name, YODS1). The communication structure YCOMM1 feeds this ODS object directly. The first line of the corresponding mapping shows the entry for this part of the data flow.
You should also note the entries in the Data target (type) column of the corresponding mapping file. The entries relating to the updates to the InfoCubes require a C in this column, and the updates to ODS objects require an O in this column. These entries ensure that the status check the system conducts when loading the data from the mapping ODS into the status ODS performs all relevant checks. For example, a status check for an ODS object includes a data activation check, but the same check is not required for an InfoCube. Conversely, the status check for an InfoCube includes an aggregate rollup check, but an ODS object does not require the same check.
Figure 4 shows the corresponding mapping for just one query or report. In a production system, this mapping flat file likely contains many more entries, as you may want to check the status of many BW queries. If, for example, you have a second BEx query (YQUERY2) that uses exactly the same data flow, then you can simply copy and paste the three lines in the mapping flat file and change the new report cells to YQUERY2. Once this mapping is complete you have the data to input into the mapping ODS object. Save the Excel file in a CSV format. To convert the file extension from .xls to .csv, use the menu path File>Save As…, name your file “mapping.csv”, and choose the type CSV (Comma delimited).
Create Report Availability Solution
Now, I’ll show you how to build the necessary objects in the BW system.
Step 1. Create InfoObjects
First, create some custom InfoObjects to use as building blocks. I’ll also use some SAP standard business content InfoObjects (with the prefix 0). You might need to install these in your system, or you may have already installed them. I find that the quickest way to create InfoObjects is to run transaction RSD1. This takes you directly to an InfoObject maintenance screen. Table 2 contains a list of all required InfoObjects and their settings. Create each InfoObject with these settings (Figure 5). Note that the system automatically populates the Data element field based on the technical name of your InfoObject.
| YREPORT |
Report |
Char |
30 |
| YBISTAT |
Status |
Char |
2 |
| YTARGET |
Data target |
Char |
30 |
| YTARGTYPE |
Data target type |
Char |
1 |
| YFREQ |
Frequency of upload |
Key figure |
17 |
| YDLL |
Date last loaded |
Char (ref 0DATE) |
8 |
| YTLL |
Time last loaded |
Char (ref 0TIME) |
6 |
| 0CALDAY |
Business Content |
|
|
| 0TCTCOMSTRU |
Business Content |
|
|
| 0TCTSYSID |
Business Content |
|
|
| 0TCTREQUID |
Business Content |
|
|
|
| Table 2 |
Create these InfoObjects with the settings shown here
|

Figure 5
Create each InfoObject using these definitions
You must manually maintain text master data for InfoObject YBISTAT. This helps explain the status codes to the BW system administrators. Go to the master data maintenance screen in Administrator Workbench (RSA1). Select Modeling area in the navigation window, then select the InfoObject from the functions window and locate the InfoObject in question via the standard search function. Choose the Maintain master data option. You should make the text entries for the status codes one at a time (Table 3).
| 10 |
Loaded on time |
| 20 |
Load in QM error |
| 30 |
Not loaded on time |
| 35 |
Not loaded |
| 40 |
Rollup incomplete |
| 50 |
Change run required |
| 60 |
InfoObject inactive |
|
| Table 3 |
Maintain text master data for InfoObject YBISTAT |
Step 2. Create ODS Objects
Now create two ODS objects using the newly created InfoObjects. To create the ODS objects, use transaction RSDODS (or RSAl>Modeling>Create ODS Object). Note that the status ODS object has the BEx flag enabled (Figure 6).

Figure 6
Define the status ODS object
For the status ODS object, enter the ODS object’s technical name, YSTATUS. Click on the Edit button. Enter Status ODS and click on the Create button. On the right side of the screen, expand the Settings area. Make sure that a check mark appears to the right of the BEx Reporting entry, as shown in Figure 6. This may be the default setting depending on your system version. Right-click on the Key fields folder and choose the Insert InfoObjects option. Enter the InfoObject’s technical name YREPORT and click on the continue icon (green check mark). Expand the Key fields folder to check that this InfoObject is now part of the ODS object.
Next, right-click on the Data Fields folder and choose the Insert InfoObjects option. Enter the InfoObject technical names YBISTAT, YDLL, YTLL, 0TCTREQUIDB, and YTARGET. Click on the continue icon. Finally, click on the save, check, and activate icons to finish creating the status ODS object.
Now, create the mapping ODS object by following the steps detailed above. Give the ODS object the technical name YMAPPING and the description Mapping ODS. This ODS object should not have the BEx Reporting setting check box enabled, because you do not use this ODS object for reporting purposes. When creating the InfoObjects, include these four ODS object key fields:
- YREPORT
- YTARGET
- 0TCTCOMSTRU
- 0TCTSYSID
Also include these six data fields:
- YTARGTYPE
- YFREQ
- YBISTAT
- YDLL
- YTLL
- 0TCTREQUID
Step 3. Create InfoSource for Mapping ODS Object
Next, build the InfoSource and update the rules to load the CSV file into the mapping ODS. Use transaction RSA1 and go to the InfoSources area within the modeling section. Right-click on an appropriate InfoArea and choose Create InfoSource. Choose the Flexible Updating in any Data Target (Except Hierarchies) button.
Enter the InfoSource name YMAPPING, enter the long description Mapping InfoSource, and click on the transfer icon (green check mark). Right-click on the InfoSource and click on the Change option. In the InfoObject fields, type in the InfoObject technical names as shown in Figure 7. Click on the save and activate icons. Click on the Yes button in the pop-up window that asks if you want to activate all independent transfer programs.

Figure 7
Define the mapping InfoSource
The InfoSource needs to connect to a source system, in this case the flat file source system (Figure 8). Click on the communication structure collapse icon to collapse the communication structure area of the InfoSource change screen. Expand the transfer structure/transfer rules area of the InfoSource change screen by clicking on the transfer structure/transfer rules expand icon. Choose the source system drop-down menu and select your system’s flat file source system. Click on the Yes button in the pop-up window asking if you want to assign the YMAPPING DataSource to the YMAPPING InfoSource. Click on the activate icon to activate the transfer rules.

Figure 8
Connect the mapping InfoSource to a source system
When loading flat files into the BW system via the flat file interface, you must put the transfer structure fields in exactly the same order as they are in the flat file. You can re-order the fields easily by going to Administrator Workbench, selecting Modeling area in the navigation window, and then selecting InfoSources in the functions window. Locate the InfoSource YMAPPING via the standard search function. In change mode, click on the move to cursor position icon  to re-order the items. Alternatively, you can highlight the row you want to move and put the cursor where you want to move it. Remember to save and reactivate the transfer structure by using the activate icon after you make these changes.
Step 4. Create Update Rules for Mapping ODS Object
Create update rules that transfer the data from the InfoSource into the mapping ODS. In Administrator Workbench’s modeling area, right-click on the mapping ODS object, YMAPPING, and select the Create Update Rules option. Select the InfoSource you created in the previous step. The system then should propose an appropriate update mapping rule since your InfoSource and ODS object contain the same InfoObjects. Some InfoObjects are included in this ODS Object only for technical reasons. These InfoObjects were included so the update rule could use them later in the status ODS. Check and activate the new update rules.
Step 5. Create InfoPackage to Load Mapping ODS Object
In Administrator Workbench’s modeling area, right-click on the mapping ODS object YMAPPING. Expand the InfoSource to display the DataSource, right-click on it, and select Create InfoPackage…. Be sure to point the Info- Package to the correct CSV file name and location; for example, C:mapping.csv. (Use the standard drop-down menu leading to Windows Explorer.)
Now schedule the InfoPackage and check that BW loaded the mapping ODS with data. Depending on your ODS settings, you may also need to activate the data in the mapping ODS manually. To do so, right-click on the ODS object and choose Activate data in ODS. Finally, check that the contents of the ODS match the CSV file input.
Step 6. Create Update Rules for Status ODS Object
Create update rules that transfer the data from the mapping ODS object into the status ODS object. Do this by right-clicking on the status ODS object and selecting the context menu option Create update rules. Click on the InfoCube button and enter the mapping ODS object name YMAPPING into the InfoCube field, then click on the Continue button. The system should propose appropriate update rule mappings (Figure 9).

Figure 9
Create update rules for the status ODS object
You also need to create a start routine to determine the status for each report. I included some additional InfoObjects in the mapping ODS object in Figure 8. BW does not populate them in the mapping ODS object. BW requires these InfoObjects in the mapping ODS object so that the system-generated communication structure 8YMAPPING has them too. This communication structure needs these InfoObjects so that the ABAP coding on the start routine for the update rules to YSTATUS has them available to update.
Now determine the values and populate them using ABAP coding. Because I included these additional InfoObjects in the mapping ODS object, which acts as the DataSource, these InfoObjects are available to use in the start routine.
In the update rule maintenance screen of Administrator Workbench, click on the Create start routine button. Enter the ABAP code from my custom program (PROGRAM UPDATE_ROUTINE) into the start routine. Click on the check icon and check the syntax, then save and activate the update rules.
Test your new update rule by loading the data from the mapping ODS into the status ODS. Click on the mapping ODS and select the option Update ODS data in Data Target… (Figure 10).

Figure 10
Load the data from the mapping ODS into the status ODS
You should also schedule the InfoPackage CCCC_FULL to periodically load the data from the mapping ODS into the status ODS. In a production system you might choose to schedule this InfoPackage to run hourly so the end users always can see the current status of the BI reports. The status ODS should now contain data. If necessary, manually activate the data in the ODS object (right-click on the ODS object and choose Activate data in ODS…).
Step 7. Create Your BEx Query
You now can make your BEx query display the results of the data you just loaded into the status ODS object. Run transaction RRMX from SAPGUI to launch BEx Analyzer and create a new query (Figure 11). See SAP help file https://help.sap.com/saphelp_nw04/helpdata/en/ba/45583ca544eb51e10000000a114084/frameset.htm for more information.

Figure 11
Define your BEx query
At this stage, you now have an accurate last load date and time for each BW report (Figure 12). This may meet end-user requirements. If you want to display the data in an even more user-friendly way, move on to step 8 to create a Web template and traffic light icons to represent the various status codes.

Figure 12
BEx ad hoc query results
Step 8. Create Web Template Class and Table Interface (optional)
First, create a new Web template using the BEx Web Application Designer (Web AD). Enter your user name and password to log on to the BW development system. The system automatically opens up a new template (Figure 13).

Figure 13
Create a Web template including table item
Drag the generic table item from the left side of the screen to the right. Link the table item to the BEx query you created earlier by entering the query name into the Query/View field of the table properties (in the Generic tab at the bottom of the screen). Change the properties of the table item to include a reference to a class called YICONS (Figure 15). Just type YICONS in the Class Interface field, which is empty by default.
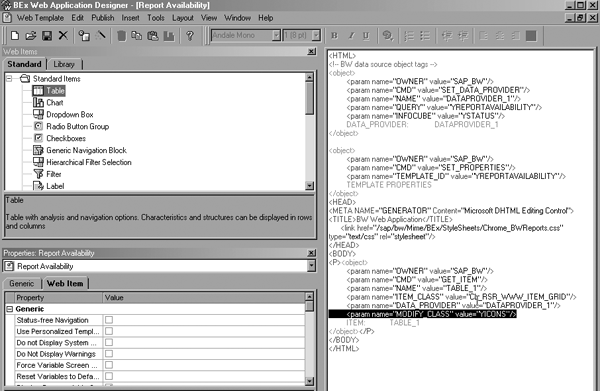
Figure 14
If your BW system is older than Release 3.5, add the highlighted line of code
Tip!
If you want to display the status as an icon later on, set the properties of this InfoObject to display key and text in the query definition. You can do this by right-clicking on the YBISTAT InfoObject within the columns area. Select the properties option and choose the Display As setting Key and Text
The YICONS class contains the ABAP code that changes the characteristic value for InfoObject YBISTAT from a number to a traffic light icon. This change happens at Web application runtime because BW calls the table interface class in much the same way that other areas of the SAP system call a user exit.
Note
If your BW system is older than Release 3.5, you need to manually enter the additional code into the table item object tag. Add this by clicking on the HTML tab on the right side of Figure 14 and enter the highlighted line of code.
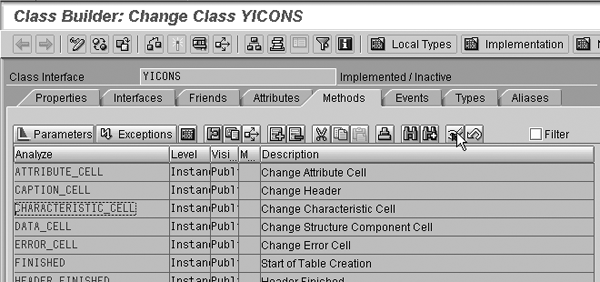
Figure 15
Change class YICONS
Note
SAP introduced the start routine in BW Release 2.0 so users could access the entire contents of a data package during data loading. The start routine is similar to a user exit. BW calls the start routine once for each data package of a data load request. It can be more efficient to perform data transformations on the entire contents of each data package rather than on a record-by-record basis in the update rules. BW bases the structure of the start routine’s data package on the communication structure upon which the update rule is built. See the
SAP help file for more details.
Create the class in Class Builder by returning to BW’s GUI and running transaction SE24 (you need a developer key to do so). Choose the Class button and enter a description; for instance, Class to create traffic light icons. Now you need to change the class so that it inherits the properties of a so- called superclass. This borrows as much of the SAP standard coding as possible and enables you to add a few lines of specific coding to create the traffic lights.
Choose the Properties tab in Class Builder and click on the Superclass button. Enter the value CL_RSR_WWW_MODIFY_ TABLE in the Superclass field. At this stage you should check the class by clicking on the Check button. You also should save the class. Next, click on the Methods tab. Place the cursor in the CHARACTERISTIC_CELL field and click on the Redefine button. Finally, add the ABAP code shown in Figure 16 and then save and activate the class.
IF I_IOBJNM = 'YBISTAT'.
IF I_FIRST_CELL = 'X'. "only pass icon for key display
CASE I_CHAVL.
WHEN '10'. "loaded on time
c_cell_content = '<img
src=''/SAP/BW/Mime/BEx/Icons/s_s_ledg_35.gif''>'.
WHEN OTHERS. "other errors
c_cell_content = '<img
src=''/SAP/BW/Mime/BEx/Icons/s_s_ledr_35.gif''>'.
ENDCASE.
ENDIF.
ENDIF.
endmethod. |
| Figure 16 |
ABAP code to create traffic lights |
Return to Web AD and execute the Web template in your Windows browser. The Web application now should display a traffic light icon corresponding to the data’s status (Figure 17).
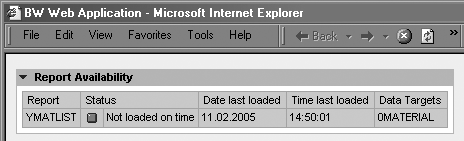
Figure 17
The Web application now displays traffic light icons
If you would like to keep multiple requests in the status ODS object, then you should add an additional time-stamp InfoObject into the status ODS object. BW populates this time-stamp characteristic via update rules each time it loads the ODS object. You then can add this characteristic into your BEx query as a drill-down characteristic to report historical data. This enables you to analyze which reports are most consistently available and which reports most often cause problems.
Philip Botterill
Philip Botterill is a senior business intelligence consultant working within Sapient's SAP practice. Sapient, a business innovator, helps clients achieve extraordinary results from their customer relationships, business operations, and technology.
You may contact the author at pbotterill@sapient.com.
If you have comments about this article or publication, or would like to submit an article idea, please contact the editor.