Using Artificial Intelligence with SAP for Dynamic Financial Environments
by Dr. Marco Sisfontes-Monge, Arellius Enterprises Inc.
Data is just about everywhere, whether you are aware of it or not. For example, your supermarket discount card feeds into a database that allows the store to analyze your purchase patterns by location, track your favorite products, and monitor which day of the month you buy them. Also, your Amazon leverages your orders and browsing history to recommend products for future purchases or that complement your current product such as buy a tripod to the camera you are trying to buy. When we do our banking online, someone greets us so quickly that we are not even sure if it is a person or a bot. We are just a number in an ocean of data. For corporations, it is even more difficult to make sense of so much data without having analytical tools, databases fast enough to provide a report and forecast products, data on customer behaviors, or the ability to analyze seasonality to keep their business running, and track inventories and promotions appropriately to manage obsolete or low demand products.
For example, during Christmas season a data analytics and artificial intelligence (AI) model can predict which products will be sold in individual stores based on current trends such as customer purchases and online sentiment. The same AI models can even place products in the locations with most traffic based on data flow of people captured by cameras and live feeds. Certainly, we are far from Skynet from the Terminator movies, but there is no doubt that we are on the path to creating systems that generate code for themselves, upgrade themselves, improve their own algorithms, and more. The bottom line is AI and data analytics are the key to making sense of this data ocean, and mathematical techniques that have been around for several years are at its core, made possible by recent advances in computing power.
Explore related questions
Oxford professor Mike Wooldrige says, “AI is hard – I hope we can all agree about that. AI is hard for many reasons, but one of the most important is that it is a subject which is hard to approach directly.” In other words, we have AI algorithms that are nothing more than mathematical techniques used to explore data but applying them requires a lot of planning, analysis, new software, and possibly hardware and require humans to validate its accuracy over time and keep feeding the model with new data. A clear example in the financial sector is the fact that traders are rushing to fintech, blockchain strategy, AI, and other futuristic subjects before robots take their jobs. According to Oxford University, AI is expected to generate $300 billion in cost savings by 2030 worldwide, partly through the dismissal or reassignment of more than 1.3 million bankers.
In response to the COVID-19 pandemic, a pharmaceutical start-up in the UK developed an application to screen 15,000 drug patterns in search for a potential cure but still nothing promising yet. The rise of AI has created the role of the Data Scientist, a person who not only understands the data being generated but also can adjust the algorithms to improve its outputs in a controlled manner by providing new information to improve the learning curve of the “brain.”
AI in general can be summarized in two types:
- Supervised learning: A type of system in which both input and desired output data are provided. Thus, the algorithms are learning from a sample data set to “learn” the rules that can then be applied to real-life data for future prediction based on the relationships found in the training data set. An example is shown in Figure 1 of a supervised learning non-linear regression model that was created to forecast TV and radio sales.
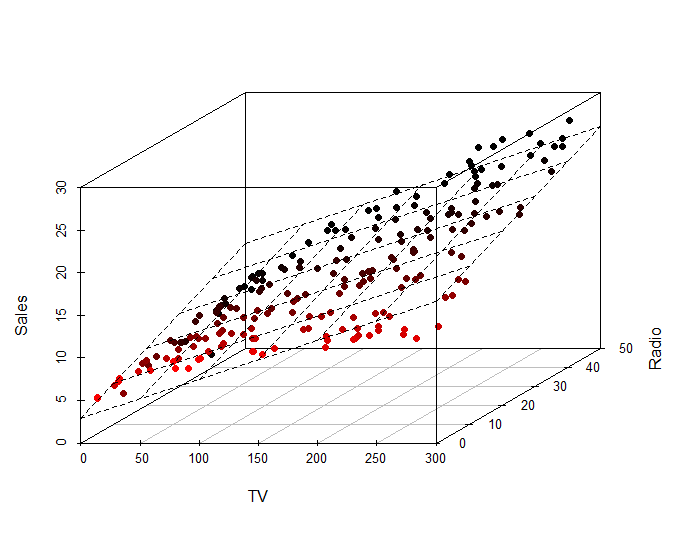
Figure 1—Non-Linear Regression Analysis Model for Sales Forecasting
- Unsupervised learning: In this case, the algorithm is only provided with an input data set without outputs. In comparison with supervised learning, the algorithm searches and learns from the data and provides the outputs. Examples of unsupervised learning are marketing clustering, popular in CRM, or using association analysis to uncover groups of data or identify rules based on the data and create new ones as the data changes. A clear example of this can be seen in your Amazon account. Based on the history, product family, and its sale price, the tag “Customers who bought this item also bought” does not appear by coincidence in these tabs as shown In Figure 2.
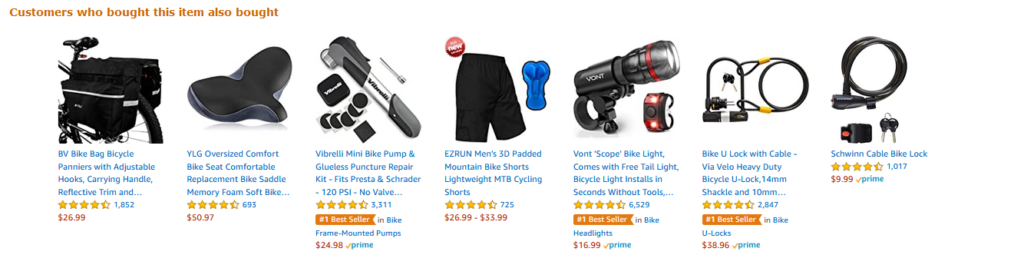
Figure 2—Amazon.com “Customers who bought this Item also bought”
For many years, SAP has provided multiple AI tools – some more easy to use than others – but provided industry-accepted mathematical tools that can be leveraged to make predictions using supervised and unsupervised learning techniques. Some examples are as follows:
- SAP S/4HANA PAL (Predictive Analytics Library): PAL is a special library available in SAP S/4HANA. PAL uses SAP HANA SQL scripts, a language called R, and a Business Function Library (BFL) that has many algorithms from which to choose. The bad news is you need to be a Data Scientist and spend a lot of time understanding the rules that control and define each algorithm in order to determine if the problem you are trying to solve can be addressed with the algorithm selection. Some of the algorithms provided in the PAL library are: Cluster, Classification, Regression, Association, Time Series, Preprocessing, Statistics, Social Network Analysis, ABC Analysis, and Weighted Score Table. From an interface point of view, SAP S/4HANA PAL is not as friendly or simple to use. For further review in PAL please check out this link
- https://help.sap.com/viewer/2cfbc5cf2bc14f028cfbe2a2bba60a50/2.0.03/en-US/f652a8186a144e929a1ade7a3cb7abe8.html
- SAP BI Data Mining Suite (APD): APD is a relatively old product that is still supported under the SAP BW on HANA platform with an easy-to-use interface. APD provides essentially the same algorithms that SAP S/4HANA PAL offers such as Clustering, Classification, Regression, Association, Time Series, and more. It integrates with your BW objects and works with BEx, ADSOs, DSOs similarly to PAL. However, APD is very object oriented tool, and contains a lot of drags and drops, which I genuinely still enjoy using, and this functionality does help to explain business users and/or developers the what, why, where, who, and how of the models. For further review of APD, feel free to review the following link https://help.sap.com/viewer/0ecf5244825c4742a7b062a89d11c2ac/7.4.19/en-US/4a24cc5cb1160456e10000000a421937.html
- SAP Smart Predict as part of SAP Analytics Cloud: The predictive experience in SAP Analytics Cloud (SAC) is simple and easy to use tool with targeted to Business Analytics. Smart Predict guides you step by step to create a predictive model based on historical data. The resulting model can be used to make trusted future predictions, providing you with advanced insights to guide decision making. The algorithms available are: Classification that allows a score that an event will happen, Regression used to find relationship between variables describing events such as estimated house price based on similar houses and Time Series Analysis to forecast evolution of a measure in the future such as how many products to produce based on history. However, this tool Is oriented more for Business Analysts to perform simple analysis and not for Data Scientists. Clustering techniques for example are not part of Smart Predict, and there are no plans In the short future by SAP to allow the end-users to choose or change the logic of the algorithms being used, thus Its flexibility Is greatly limited. For further Information on Smart Predict check out this link https://www.sapanalytics.cloud/guided_playlists/getting-started-smart-predict/
- SAP Leonardo (Machine Learning) is a powerful tool for both supervised and unsupervised learning that offers data integration with multiple big data platforms like Hadoop, SAP Vora, and SAP S/4HANA, and is designed to support the Internet of Things (IoT). SAP Leonardo is a collection of tools and applications built on SAP Cloud Platform that be used to create an administrative environment for managing and monitoring sensor data generated by technical objects that are part of the IoT. In addition to the API services, SAP Leonardo IoT offers several apps that are built upon the service and help you step inside the world of IoT. For further Information on SAP Leonardo check out this link https://help.sap.com/viewer/product/SAP_Leonardo_IoT/1904b/en-US
At this point, it is clear that AI is very hard and time consuming. To develop the right model with the right mathematical techniques and with the appropriate software to guarantee data accuracy and consistent results is also a difficult task. On top of that, it is a sophisticated subject that your average manager or top executive will feel overwhelmed to even discuss unless it saves money, time, or resources. And it still won’t be their cup of tea unless the technical team deploys a very easy to use environment that is directly related to the software chosen, and don’t even mention the word AI to your users at the beginning.
In this article, I will review a very common problem for sales commissions, and I will use some of the AI methods discussed in order to find a practical solution that can be easily explained to managers, technical teams, and most importantly, easy to report without any major complications. Yes, AI could be easy, but that’s the challenge that your model or AI environment will have to face that the algorithms are being applied without people knowing that it is AI so they don’t feel intimidated by just hearing the term Itself. Certainly, SAP has the tools for it, but it requires a very mature and different breed of consultant that is not always easy to find depending on your implementation platform with a combination of software and mathematical background so that person knows what software to choose and what mathematical technique to apply to make It easy to use, efficient and accurate.
In summary, there is no Skynet yet, but currently the design and deployment of intelligent systems is a major driving force in the industry. We still do require some human interaction to improve the algorithms, improve the code or the software by providing new information; or more variables to fine tune the “brain” and its “decision making” rules. I personally was involved in a large utility in the United States, and we developed an intelligence system using SAP that reduced the need from over 500 analysts to just 2 in a matter of 12 months. Certainly the human impact and productivity is a difficult reality that we are facing more and more as technology becomes “smarter” and more powerful.
Building your AI Model
Ok, so you got approval to investigate some of the SAP systems described above. Good for you, so now make it happen! The issue is where to start. After building thousands of models in many industries, I came out with a business process that works for me and helps me to zero in on the elements needed to be built for an intelligent system. These steps are described as follows:
- Define the problem: Clearly state the problem that you are trying to resolve in a way that will make it easier to identify the mathematical methods to use later on. Example: create a calculation engine for sales commissions by sales representative by customer and product that can be changed on a weekly basis based on product demand.
- Define the “Universe” or Microworld you want to control. Example: Sales Commissions G/L postings for actuals data on a monthly basis and it must be added to the Cost of Goods Sold (COGS).
- Understand the process. Example: Calculate the commissions for each sales representative by region based on product hierarchy and customer number. These classifications change every month depending on the demand and obsolescence of a particular line of products and based on the season. In this way, if a product is about to become obsolete, the commission rate will be higher in order to literally push the last inventories available before they are discontinued. After all these calculations are done, there should be some way to update the Cost of Goods Sold (COGS) in Financial Accounting because it is obvious that the costs are significant and a report must be generated for each Sales Representative and the total values of their sales by product.
- Identify variables and how to measure them. If we use the dependence or causation relationship, not the mathematical calculation, described below as our model guidance, It Is possible to say:
- Relationship 1: X1+X2+X3= Y1
- Relationship 2: Calculate the commission value (Y2)= (Total Invoice Value * Commission Rate (Y1))/100
Where:
-
- X1: Sales Representative Number for each Region. Provided by Marketing.
- X2: Material group, provided by Inventory Management and Material Master (MM)
- X3: Product hierarchy, provided by Inventory Management and Material Master (MM)
- Y1: predicted commission rate, which Is provided by the sales manager.
Total Invoice Value, from the SD module.
-
- Y2: Calculate the commission value
- Define the Model. Example: For a supervised learning model, provide a data set (the list of products by sales rep with the commission percentages) that can be changed on a weekly basis, or any time that you feel like It, with NO ABAP CODE. Once the model is trained with the list, these rules are applied to the transactional data for the week, day, hour, or time that you choose, and both commissions percentages (relationship 1) and Commission Value (relationship 2) are calculated.
- Identify the Inference Rules: these are the rules to be used to train your model, and these rules will be the equivalent of your ABAP code or Scripting program code. How you define the Inference Rules It Is up to you, but remember, your rules can change at any time since new products are always Introduced, seasonality, over purchasing, Inventory obsolescence, defective but still useable product that can be sold at a discount, new sales representatives added or fired, also sales representatives share and/or lose product lines due to performance, and more. All these conditions must be easily met with your Inference Rule table shown In Table 1, remember NO ABAP PROGRAM.
Table 1 provides the constraints and restrictions for how our commission rate will be calculated and applied to the transactional data. This data example applies to Sales Representative 9901 (REP_NUM), Customer Number (CUST_NUM), Product Hierarchy (PRDH), and Commission Rate Percentage(COMCALC) paid to the Sales Rep, and thus Table 1 will be the table to be used to FEED the “brain” with Inference Rules. This table never changes, but the values inside the table can change any day. The list shown In Table 1 shows a few rows of the commission list created between Sales Manager and Inventory Managers provided on a weekly basis, and these would be the training rules for our AI engine. If the combination for a specific Sales representative is not in the Table 1, the sales representative will not receive a commission for that sale, and/or a value 0.0001 would be assigned to describe a combination where the sales representative wont be paid a commission.
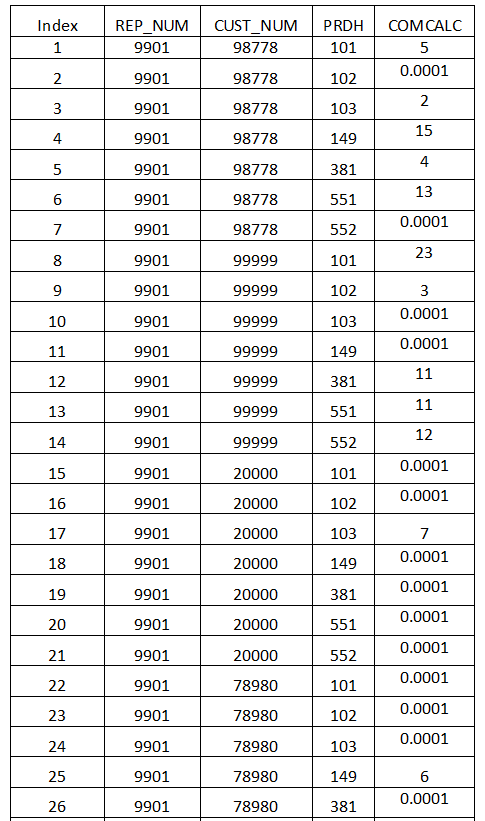
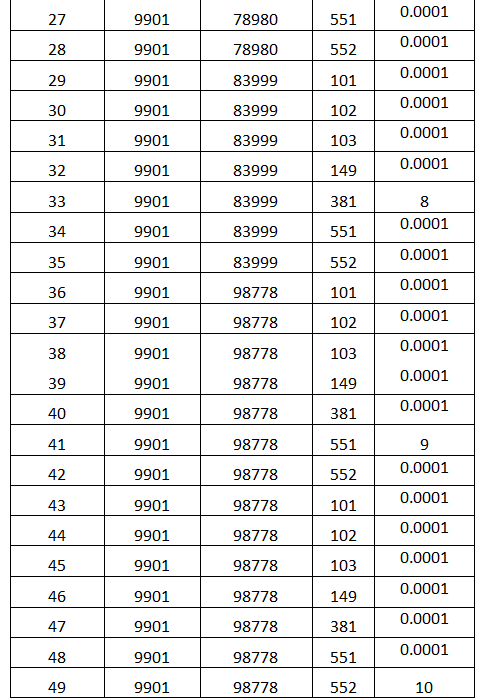
Table 1—Sample of Inference Rules for ONLY Sales Representative 9901
- Define the algorithm that works best. Example: Based on mathematical experience, this is a classification algorithm problem, and decision trees are the best solution based on the data, the relationship between variables, the number of variables being measured, and the logic of the calculation. Generally, a model trained with nearly 100% accuracy for classification problems is the ideal. With any combination of transactional data received by the model, a commission must be calculated. If not met with the rules, it would be zero or a number close to it in this case 0001. Remember we are dealing with people’s paychecks from the Sales Department who is responsible to generate revenue to the company, and certainly it is a very delicate calculation with lots of issues involved for the company and it must also remain a hardly guarded with security meaning Joe must not know that Bob makes more money than him. We will use the SAP APD functionality since it is more graphical and easier to explain the logic, but certainly you can use the SAP S/4HANA APL functionality as an alternative.
- Build the Training Model: SAP APD has the classification and inference engine ready to go as drag-and-drop, and the training object is also an icon that takes the information from a flat file. The same table was shown in Table 1. As shown in Figure 3, we defined the Y1 Commissions Rate (the variable to Forecast), and the Customer number (CUST_NUM), PRDH(Product Hierarchy), and Sales Representative Number (REP_NUM). After uploading Table 1 into your training model, the system provides an accuracy estimation and model status. As shown in Figure 4, our Decision Tree has 100% accuracy and we received the confirmation that the model is successfully trained since of course, everything is green! So at this point, we have rules stored in a flat file, and uploaded into the system in a matter of seconds. Our model has been trained and is ready to apply these inference rules to the real-life transactional data using a data flow.
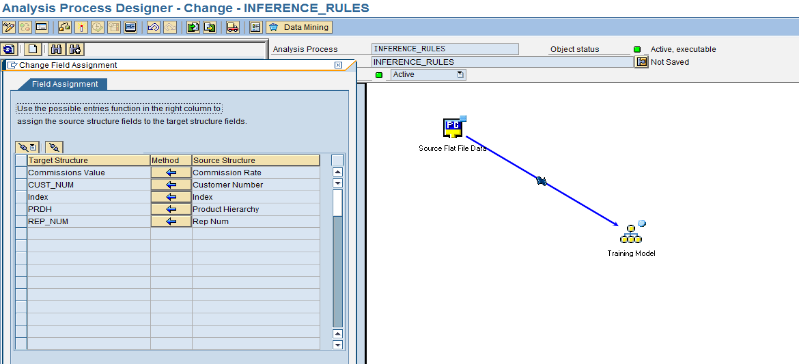
Figure 3—Training model for the Sales Calculation Engine
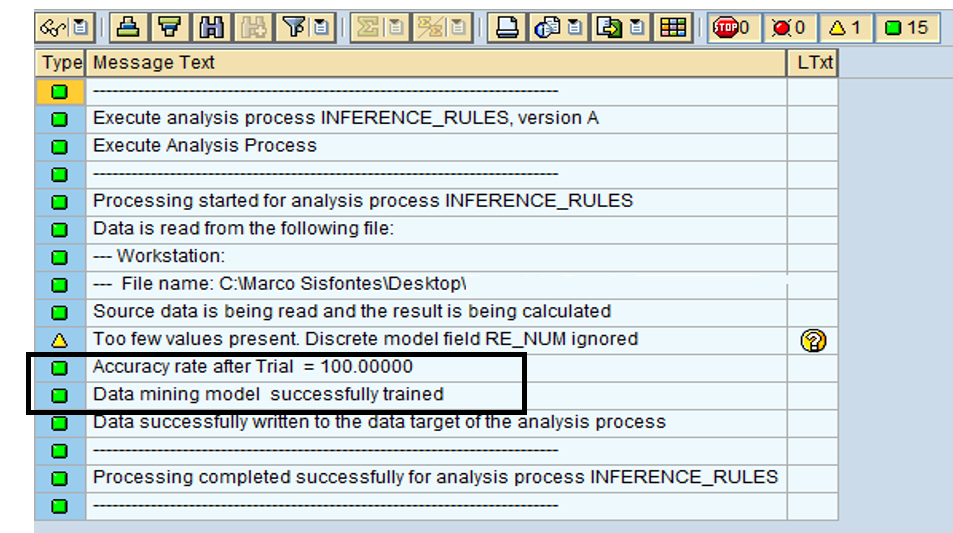
Figure 4—Model successfully trained with 100% accuracy
- Review the Inference Rules: Regardless of the system chosen, you must review and validate that the inference rules work, and they are available. Depending on your model, sometimes you want to allow not a 100% accuracy, since variation allows the system to identify inaccuracies or perform estimates as it learns and you can forecast with a 90%, 95% or more of accuracy. The key part of a intelligent system is that it can forecast and learn, and variation provides that room for learning and improving your model. As shown in Figure 5, when we open the inference model that contains the inference rules from the flat file, we see that a Decision Tree has created 2 leaves identified with grey triangles: Customer Number and Product Hierarchy. Here is where ABAP developers get upset. Figure 5 is the program that will be applied to your data and we are ready to execute it with no coding!
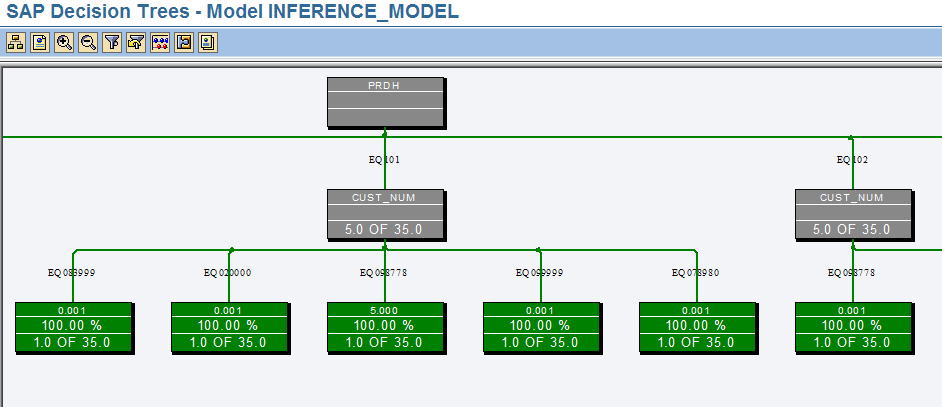
Figure 5—Reviewing the automatically generated Decision Tree
- Identify your Target:Create your ADSOs, upload your transactional data using a flat file, or any procedure chosen how the transactional will be stored. We need data that matches the inference rules or we will miss a lot of values. The master data of the transaction data must match with that of the inference rules file. For example, if the master data used to train the AI Model to create model 1 Product Hierarchy Master Data value was 101, and the Master Data value in the Transaction Data for the Characteristic Product Hierarchy is 0101, the inference rules will not be able to identify the differences and perform the calculations accordingly just because there is a master data mismatch. So, make sure that you train your model with the proper master data that matches your transactional data before applying it to your transactional data. As shown in Figure 6, the master data looks consistent with the training rule Table 1.
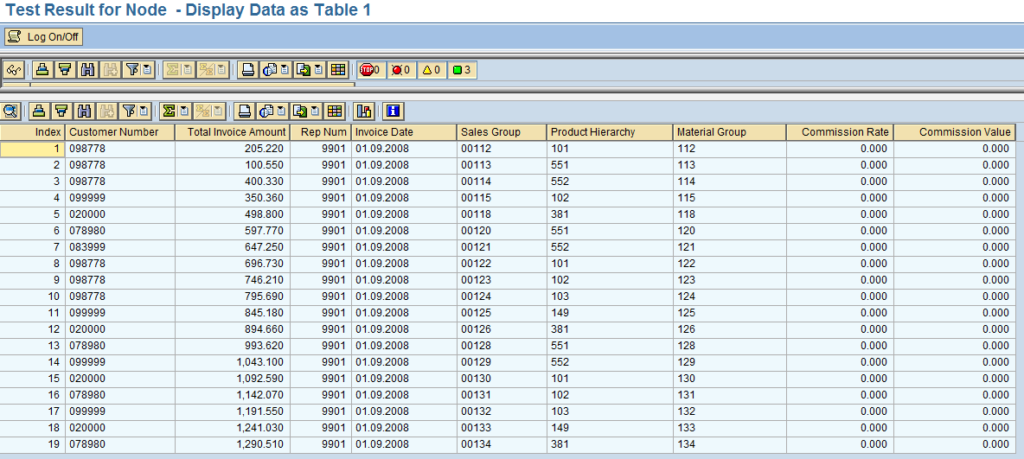
Figure 6—Reviewing the transactional data where the rules will be applied
- Apply your Inference Rules Model to the Transactional Data Target: Here is where things get interesting. As I mentioned, SAP APD is very graphical so in this case we just need to create a transformation/mapping object to our target object that will store the calculations. In this case, we called the Target “Calculation of Commission”, and we linked it with the object called Decision Tree 1 as shown in Figure 7.
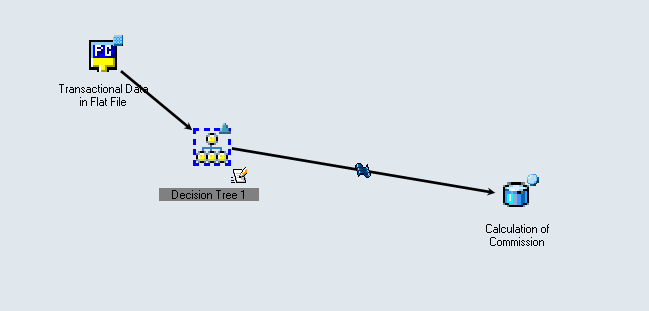
Figure 7—Applying the inference rules to our transactional data
- Review your Output: Once the model is executed, we will review the values of the Commission Rate calculated available in the transactional data. Notice that we are calculating Commission Rate column, and not the Commission Value yet. As noted, based on Rep_Num, Product Hierarchy, and Material Group have successfully populated the values in the Commission Rate column as shown in Figure 8 that were previously empty in Figure 7.
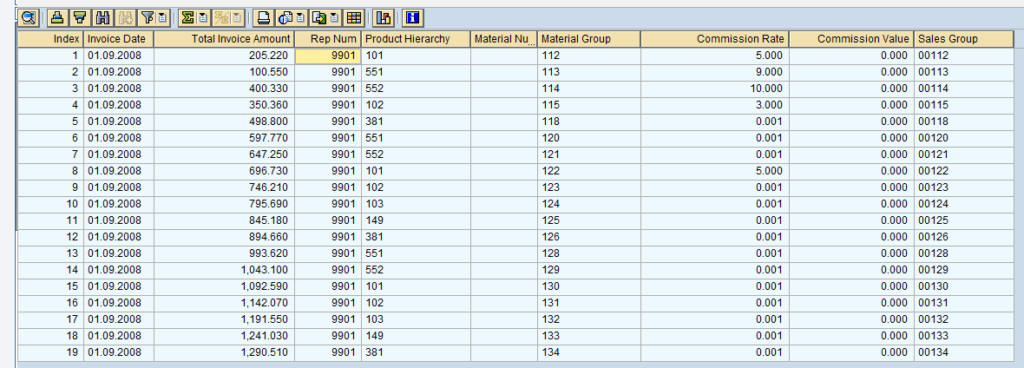
Figure 8—Commission Rate calculated using our trained model
As shown in Figure 8, for Sales Representative (column Rep Num) 9901, the Commission Rates have been calculated according to the relationships created with Model 1. If the transactional data does not meet the criteria the value 0.001 would be displayed, proving once again that the model identified the relationship and no commission value should be paid. You must be careful to remove any 0.001 as part of your reports to make sure that does not confuse your users or pay small amounts of decimals to a Sales Rep that should not get paid at all if the conditions are not satisfied, and you can easily remove it once you integrate the target object with the rest of your financial calculations using SAP S/4 HANA tools. The value is for information purposes for the algorithm. I recommend use the SAP BW Tools for S/4 HANA to make the process seamless.
- Complete any other calculations: After we checked to see if the inference rules are working, we need to see any missing calculations. Certainly, the final formula shown below, requires the model adjustment shown in Figure 9 to complete the process from a data flow, with a data transformation shown with the formula below and displayed in Figure 10.
Commission value in USD (Y2)= (Total Invoice Value * Commission Rate)/100
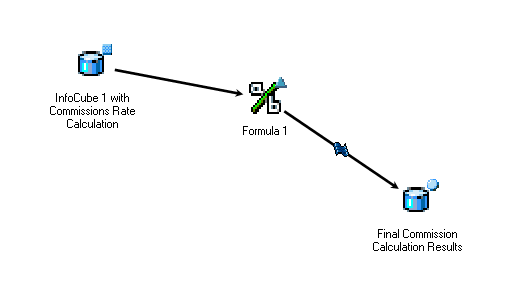
Figure 9—Calculating the commission per invoice
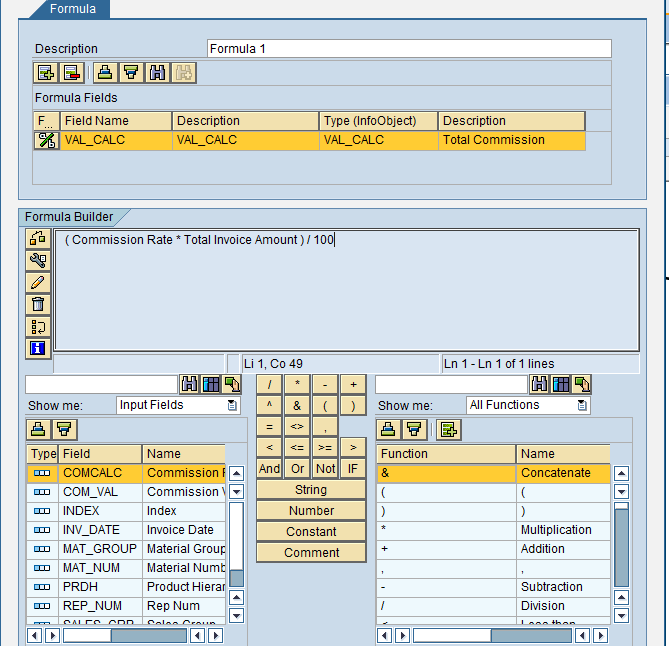
Figure 10—Calculating the commission per invoice
- Validate and Report: Finally, our job is done. We used an AI technique in order to create something real and tangible and valuable for your company. Now your custom table, Bex query or ADOs or cube must be integrated with your financials and link all values to your COGS accounts using SAP HANA tools. The best part is it is easy to integrate with your HANA architecture, can be reported since it is stored in a BW Object, and we can use BOBJ, AO, Fiori, etc. to report on it using a traditional BEx query. Again, we are focused on the procedure. It all depends on the procedure and technology chosen, but I hope you feel more comfortable with the term of Artificial Intelligence and now you have a better idea how to apply it in your implementation.
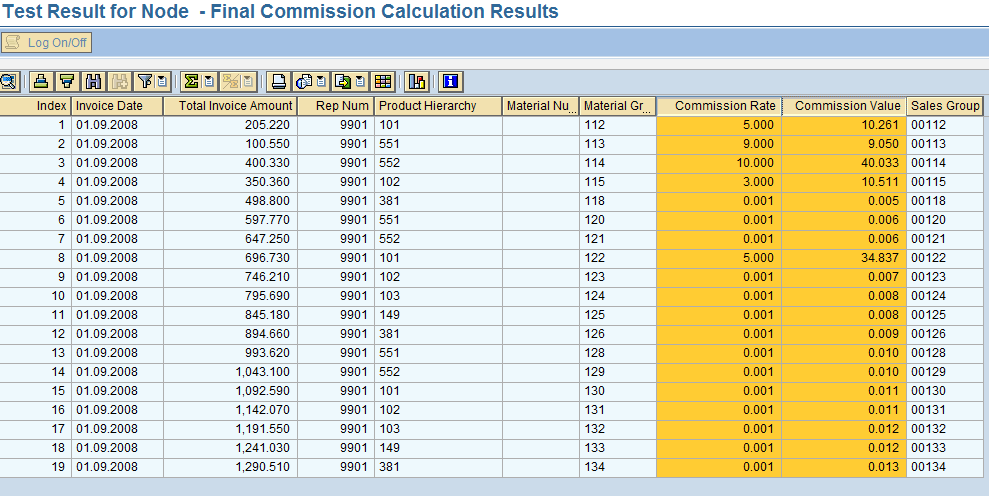
Figure 11—Our AI model is completed and calculations validated
Conclusion
We achieved the goal and now we are able to calculate commissions per invoice on a weekly basis in order to push aging inventory to customers in any way necessary using our sales representatives and with commission based incentives. The best part is we don’t need to recode a complete ABAP program every week since the rules are controlled using a flat file that the controller of the company can maintain. We can change the rules daily, hourly, etc., as long as the overall model does not change. The values inside the file can change and be executed any time and reported using any of the SAP reporting tools.
Any time the model needs to be adjusted, just review the variables, adjust the fields and the inference rules, apply it to the data, and determine when these rules would be applied moving forward. As shown in Figure 11 our commission calculation model is completed, and we have successfully able to create a true and practical AI Model using SAP technology.