SAP HANA is one of the most significant releases in SAP’s history. It represents an enormous shift, bringing traditional ERP processes and functionality together with a high-performance data analytics engine embodied in SAP HANA. Hear directly from SAP Expert Kurt Hollis with key insights into the SAP HANA release strategy and your steps to success with a hands-on demo as he answers your questions, including:
- What is the timeline for SAP HANA releases and the revision strategy?
- How can you manage performance in SAP HANA Studio and Cockpit?
- What are the key steps to baseline and optimize the performance of SAP HANA?
The following is a transcript:
Introduction
I am Kurt Hollis and I'm an SAP expert with a background of 23 years. Currently I am a consultant and manager for Deloitte out of the Philadelphia area and I’ve worked hands-on with projects where I've taken some of the tips for performance administration operations and helped to make businesses HANA systems run better. Today I’m going to get into a few topic areas around HANA, including release, mini-checks, monitoring, studio, cockpit, and a few others.
What is the timeline for SAP HANA releases and the revision strategy?
Currently there are two streams of releases with HANA. There's a 1.0 release. It's up to version 12 SPS patch as a patch level that's stabilized. And then there’s the HANA version 2.0 as well, which has been running in parallel, and you can migrate from one to two. Currently we're at SP4, patch 46 is the latest.
Some years ago, the HANA releases were coming out at a very quick pace. Now it's once per year. In April of 2020, which is just around the corner now, springtime, is the time for the new release of SPS 05 of HANA 2.0. We're looking forward to that release. The following figure shows the revision strategy for HANA 2.0.
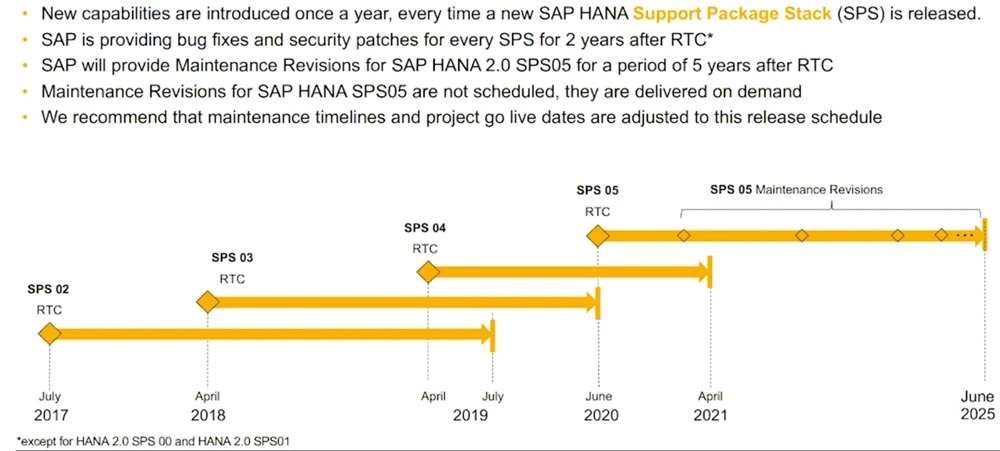
What you can see is right now, since April of 2019 through April of 2021, SPS 04 is supported. Coming in June 2020 will be SPS 05. Maintenance revisions will occur periodically throughout that lifespan, up through now SPS 05 shows being supported through June of 2025.
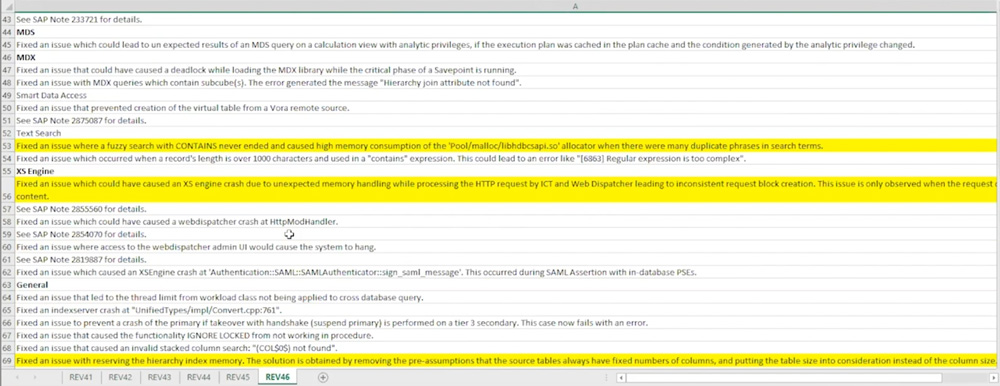
We have the various support pack levels coming out periodically. On a current project we’re working on a version 40 and revision 46 is out. What I did is put all the patch information available from the SAP notes into a spreadsheet highlighted in yellow what was important to us and what fixes were notable, as you can see in the following screenshot.
Based on that I made the decision to go ahead and upgrade to the patch level 46. The patch level takes about three or four hours. You have to take a backup, take the HANA system down, apply the patch, and you're back up and running rather quickly.
Of course, it's good to do a test cycle at the lower landscape before you roll this into production. So we did all that and we were successful in rolling this out. We chose a Saturday or Friday night and then, come Monday morning everybody, was happily running the new release.
That is a little tip about the revision strategy.
How can you manage performance in SAP HANA Studio and Cockpit?
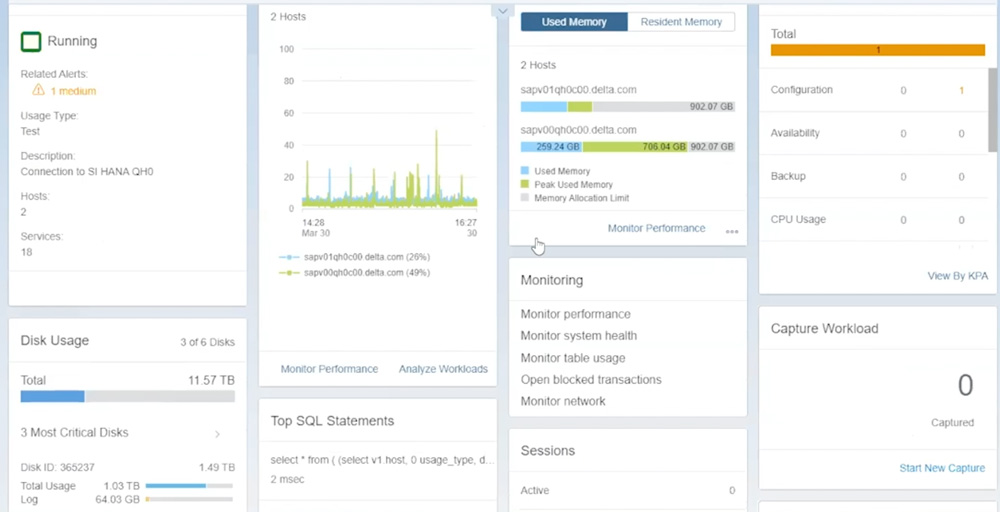
Everyone is familiar with the HANA Studio. It is your Java-based Eclipse-based tool. A very popular main tool for supporting HANA. And two of the key areas are in the overview page is the used memory and the CPU usage. And as you can see in the following screenshot, I have a yellow resident memory alert on the screen.
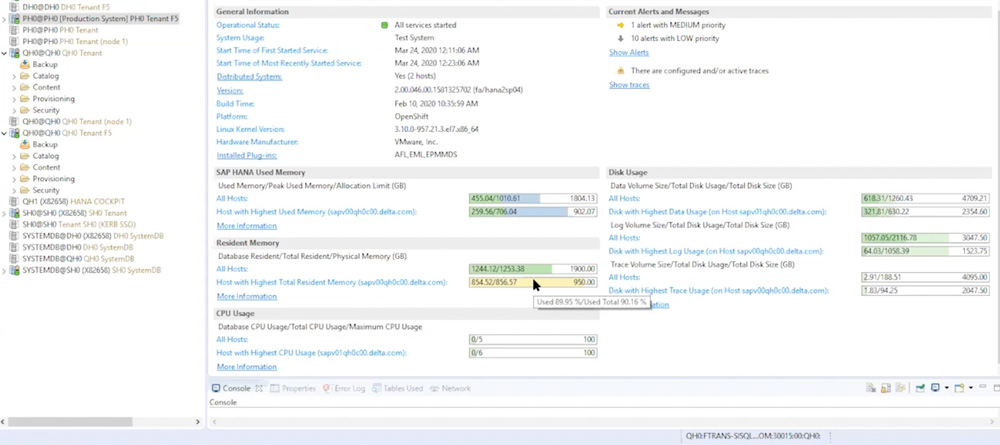
It just shows me that it peaked up to 856 gig out of 950. It's a one terabyte node. This system has two one terabyte nodes on a scale out and we could see where the usage does peak up at certain times. So this is a good overview to find out what's going on with the memory, the CPU, and the disc usage.
HANA is an in-memory based system. Memory is a key point to look at for performance, making sure that the memory stays within the resource limit. In addition to that, it's not uncommon to see the CPU spike up. In the following screenshot you can see an example of where the CPU spiked up twice, and this just happened today actually in one of our test environments.

There was a red circle exclamation point on top. That was an alert that came out. It's saying that the CPU resources ran all the way up to 86%. This is an alert for me to look at, to see what is running that caused this. This memory or CPU utilization, when it runs for more than just a few seconds, can set off the alert.
It’s very important to have the alert set up so it emails the administration people, and this brings it to our attention to take a look and see what's going on in the system at that time. What this means to me is a very expensive statement that ran. That's consuming all the CPU at one time. Now you notice overall it's rather low with a few spikes, but these two spikes are indicating that it’s potentially a problem.
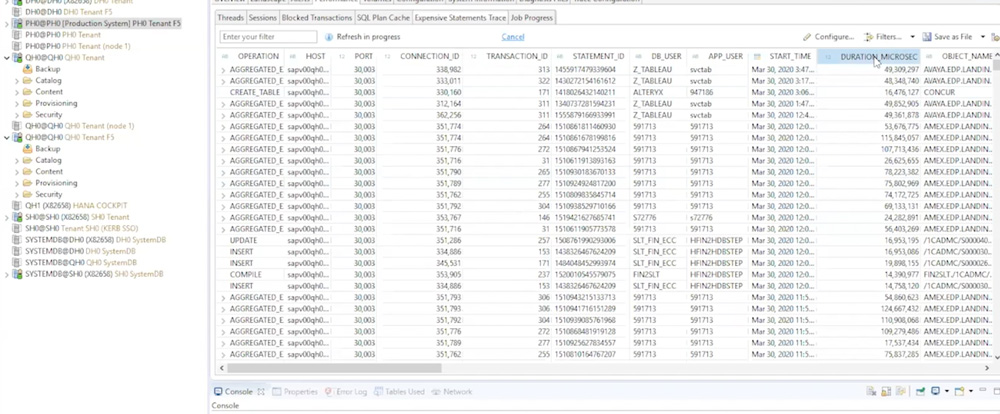
In this scenario I would go into the Studio or into the HANA Cockpit and look at the overall statements that were running in the system at the time. In the performance tab shown in the following screenshot you can see my expensive statements and I can see that there's some Tableau reports running and perhaps what it was, if I sort on duration, I can see the long running expensive statements that may have caused that alert to happen.
I can analyze that statement, and, if I wanted to, rerun that statement with a plan analyzer running in the PlanViz running into Studio. There'll be more information on that in a future session, how to use the plan analyzer to troubleshoot the performance of SQL statements in the system.
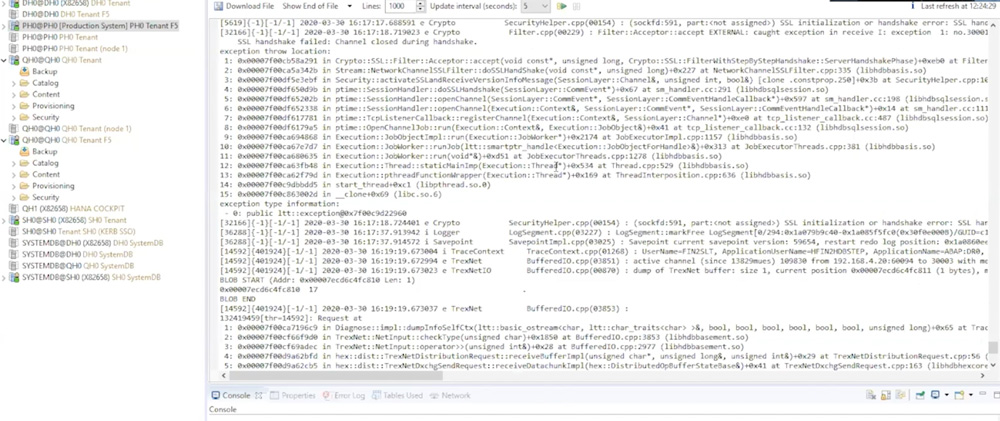
Another important area to take a look at is the diagnostic files continuously, seeing if there's any alerts or dumps and making sure that in this case it looks good and clean. There are no serious problems occurring. But every day we look for alerts.
We also look at the trace files to see what's in those degrees files to see if there's anything that we should be paying attention to. There's always something in the alert files that you can look at and improve the system, making sure that it's stable.
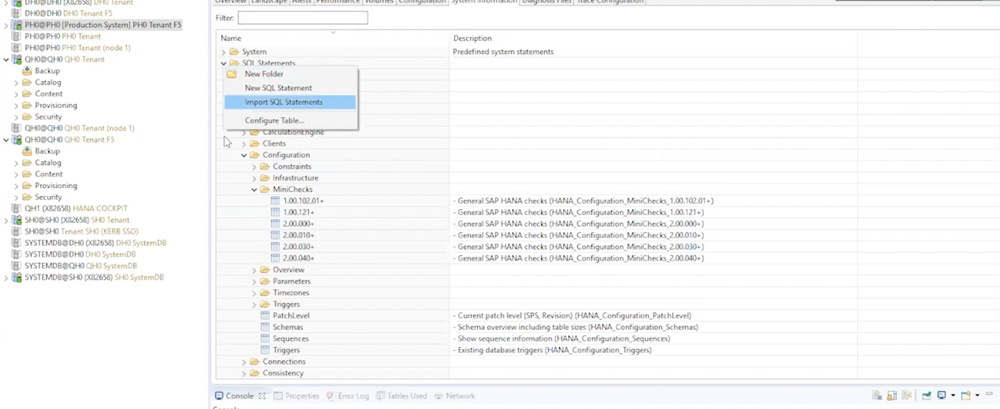
Another thing I want to talk about here is what's called the Mini Checks. Just like you go to a doctor and you have your cholesterol checked, the Mini Checks is a program that you can run as provided by SAP in the SQL statements as an attachment.
If I go to the system information tab, I can add a new folder and I can import SQL statements into the system. And what this gives me is a whole list of hundreds of SQL capabilities of statements that I can use to check the health of my system. These are not there by default. I have to add them in by pulling the SQL statements note and importing the attached file.
It gives me all the capabilities. For the Mini Checks, run this on a periodic basis, maybe after an upgrade of the system before you’re making any significant changes.
You can run these and it breaks down by area: operating system, discs, IO, and latency. Many of these are performance related and I can see the value that I have and what the expected value is. For example, the current allocation limit for memory is 21. The expected value is to be less than or equal to 80.
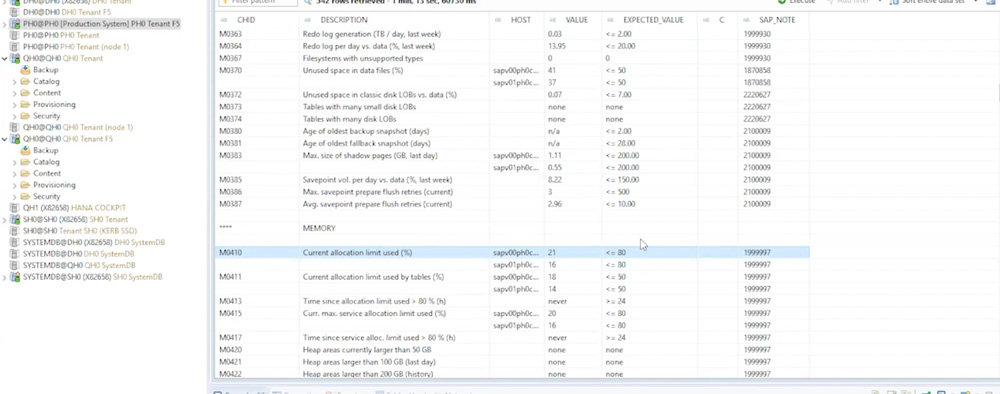
If there is a problem, it will be noted with an X in this column. In the above screenshot it shows me that there's a time zone problem, alerts, some compression issues. These are the things I would investigate, the ones with the X in this column. It automatically marks which ones are flagged as being out of compliance.
The running of this report gives you a very long list of things you can look at in your HANA system from a performance perspective. One other thing I want to point out in the very far right column of the above screenshot is the SAP note. If you want to look more into what's going on with this particular issue, there's an SAP note as specified in the right hand column that you have. If you open up that note you can read about what you can do to help with this issue that you're seeing in the system.
Overall, the Studio is very important in helping maintain the operation of the system. That's one of the main tools, but more recently is the performance capability and monitoring in the HANA Cockpit.
When you go to the home screen of the HANA Cockpit, it's just like a Fiori dashboard of a CPU usage and memory usage. Many of the same capabilities are in here that you get from the Studio. But you get some extra capability in here for managing single sign-on, data encryption, capture and replay workloads, and other advanced capabilities that are not available in Studio.
Together, Studio and Cockpit are two of the greatest tools we have to take care of your HANA system. Everyone should have a Cockpit system in their environment. The Cockpit is built on another very small HANA environment, 64 gig, 32 gig. That's the HANA Express Edition.
In addition to this, I wanted to bring up the tool called HANA Cleaner.
As the system is running, things can tend to build up, such as the Hunter catalog, which is a backup catalog. It keeps track of all the backups that ran in the logs. You have diagnostic trace files. The system can grow in certain areas where they need to be cleaned up. So the regular clean up utility is called HANA Cleaner.
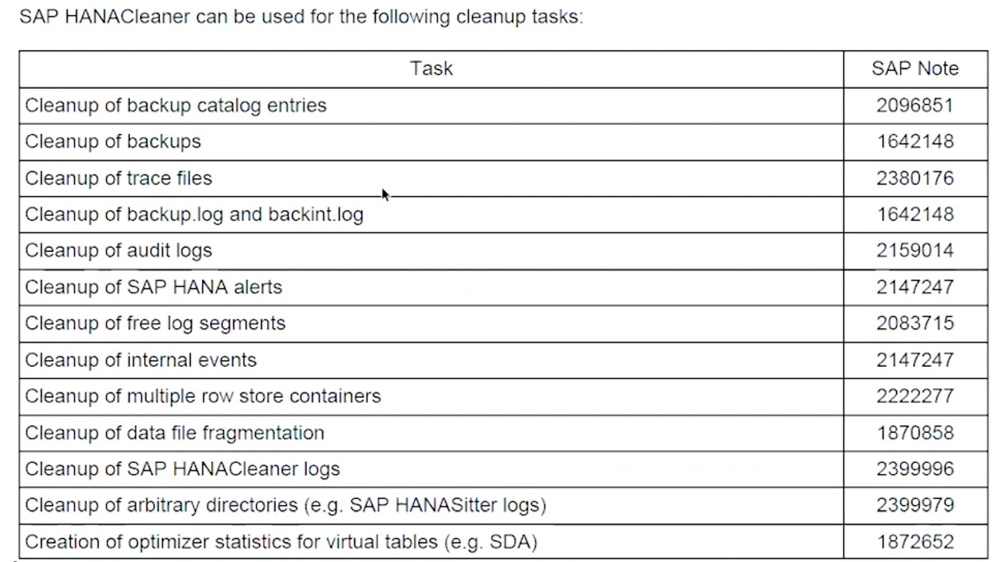
It's a Python script that runs at the operating system level and it cleans up the backup catalog entries, backup trace files, free log segments, and important things like this.
What are the key steps to baseline and optimize the performance of SAP HANA?
Key takeaways include:
- Use SQL statements and Mini Checks to help baseline your systems
- Taking a look at the HANA Cockpit for any heavy CPU or memory usage and, using the expensive statements, trace to drill down and find out what's going on and what SQL caused the alert to occur
- Once you get the expensive statement, you can use the Plan Visualizer and other tools to break that down and analyze what happened in that SQL.
Typically, if you're running SAP S/4HANA or SAP Business Warehouse powered by SAP HANA, those systems are already very well tuned and you shouldn't have that many expensive statements that are running in the system since those are very compact and well planned SQL statements.
However, if you do find one, you can actually see what caused it. Maybe it's caused by a particular job that's running in SAP S/4HANA or SAP Business Warehouse powered by SAP HANA. Or if you're running SAP HANA as a sidecar and pulling data in big data and running your own analytics, which I am in this case, then I could analyze what was running.
For example, in our system we have Tableau running reports, and Tableau can tend to run some very expensive SQL statements. I can analyze that and then help those SQL statements to run better. There are a lot of opportunities and tools out there. That's one of the areas that I am working on as well as things like replication, and high availability and disaster recovery for SAP HANA.
Which additional resources would be useful?
If you want to get more information, make sure you go to
https://help.sap.com, search for HANA Enterprise, and then you'll find the documentation for two big books that I recommend. One is the administration guide, which is several thousand pages. That's like a main big book that used to be many different books, all consolidated into one.
There's also a performance and optimization guide that is very good. Make sure you're pulling down the latest version of it. The other thing is, you would need to have an account for the SAP and HANA notes. There's a release note that I showed you today that includes many checks with the SQL statements and the attachment.
There are a number of FAQ notes that you can click on that will give you a list of all those notes. There's about a hundred different FAQ notes that SAP publishes that are very specific on each topic. To me that is an addendum to the administration and performance optimization guide that are extremely important.
Anytime that you want a deep dive into a certain area, like the Mini Checks checks, for example, you can pull the latest copy of the FAQ note and read that. There are about 10 pages of information in each note that is very important to review.
Editor’s note: This transcript has been edited for clarity.