Learn the process flow of an SAP Advanced Planning and Optimization (APO) supply network planning (SNP) heuristics run. Follow a step-by-step procedure to configure and run three types of heuristics and interpret the results.
Key Concept
An heuristics run can be broadly classified into three categories: location, network, and multi-level heuristics. The main characteristics of heuristics are:
• The plan (output) generated from this algorithm may not necessarily be feasible (i.e., unconstrained plan)
• The algorithm looks at demand and does a netting calculation using current inventory levels, target days of supply, and safety stock to generate a plan
• The planner might have to use capacity leveling to generate a feasible plan based on capacity restrictions and other constraints
SAP Advanced Planning and Optimization (APO) supply network planning (SNP) helps to provide medium- or long-term planning or procurement of products to meet customer demand. SNP heuristics help to plan the constant flow of products through the entire network of the supply chain.
SNP provides three basic algorithms to integrate purchasing, production, distribution of demand, and transportation:
• Heuristics
• Capable-to-match (CTM)
• The optimizer
SNP does cross-plant planning (i.e., plans for all sources of supply from the customer, through distribution centers to the plants and their suppliers). Different algorithms differ on the constraints that are considered, the way they make decisions, and on the level of aggregation at which they perform the planning.
Results of SNP heuristics help you to understand the amount of products that need to be purchased or produced from the medium- or long-term planning perspective.
An heuristics run does not take available capacity into account, so there is a possibility that it could generate an infeasible plan. If the heuristics run results in a capacity overload, it can be overcome with the help of a capacity-leveling process.
Figure 1 shows the high level steps that are performed in SNP.
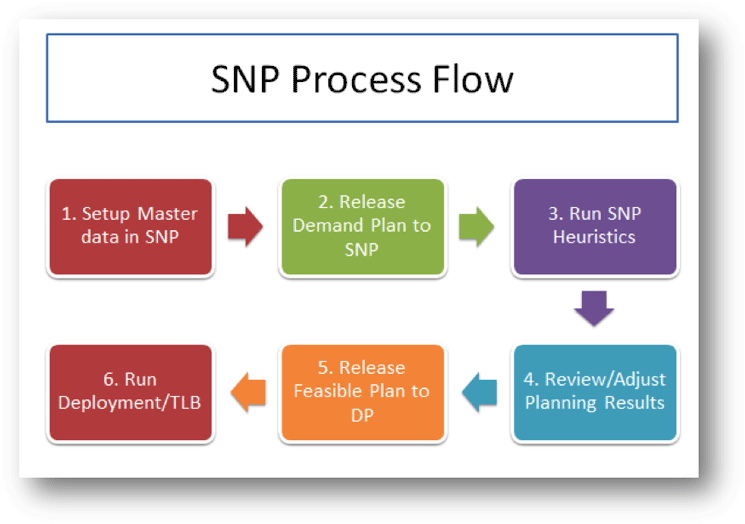
Figure 1
SNP process flow
After an SNP heuristic run, we get constrained plan. This final plan is released back to Demand Planning to compare the original forecasted volume against the constrained plan. Planners can adjust the forecasts accordingly. Note that the step of releasing the forecast back to Demand Planning is optional and it differs based on business requirements. It is also possible to skip this step and run Deployment/Transport Load Builder (TLB) directly. Deployment helps in determining which demands can be covered by present supply. TLB is used to build stock transfers confirmed by deployment for various transport means and ensures that they are loaded to full capacity.
• A multi-level heuristic run creates receipt elements for not only selected product at all locations but also, all the components of the selected product are also planned at all locations. This is basically the equivalent of a cross-location material requirements planning (MRP) run.
Low-level code helps the system to control the planning sequence. Low-level code is the lowest level at which product appears in a bill of material (BOM). This is particularly useful in network heuristics and multi-level heuristic as the system does cross location planning. Low-level code helps in determining the correct sequence of location products and then does the planning. To understand, consider there are two finished goods (FG): Materials FG A and FG B as shown in Figures 2 and 3 and their corresponding BOMs.
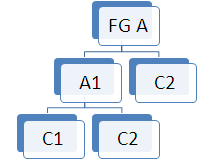
Figure 2
BOM of FG product A
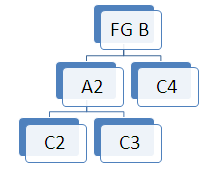
Figure 3
BOM of FG product B

Figure 4
Low-level code
Figure 5 diagrams the supply chain network that has been considered for discussion in this article.

Figure 5
An example of a supply chain network
Master Data
Locations
Table 1
| Location type |
Description |
| 1001 |
Production plant |
| 1002 |
Distribution center |
| 1007 |
Storage location material requirements planning area |
| 1010 |
Customer |
| 1011 |
Vendor |
Table 1
Important location types in APO
In the initial screen that appears after you execute transaction code /SAPAPO/LOC3 (Figure 6), enter a name (e.g., PLANT1) in the Location field and a value for the corresponding location type (e.g., 1001) in the Location Type field. Click the Create button.
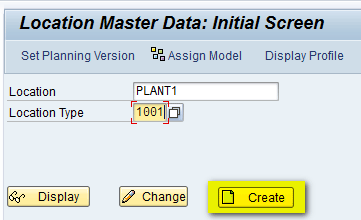
Figure 6
The Location Master Data initial screen
In the next screen (Figure 7), enter a description for the location (e.g., Production Plant – 1).

Figure 7
The Location Master Data header screen
Once a description has been entered for the location, navigate to the Address Tab and in the StreetAddress section, enter the country details (e.g., US) as shown in Figure 8. This data helps the system to allocate the correct time zone.

Figure 8
The StreetAddress section of the Location Master Data screen

Figure 9
The Calendar tab
After the calendar tab, you can also navigate to the resource tab as shown in Figure 10 and enter a handling resource. A handling resource is needed if you use goods receipt processing time in material master. Resource inbound would be used for goods receipt and resource outbound for goods issue.
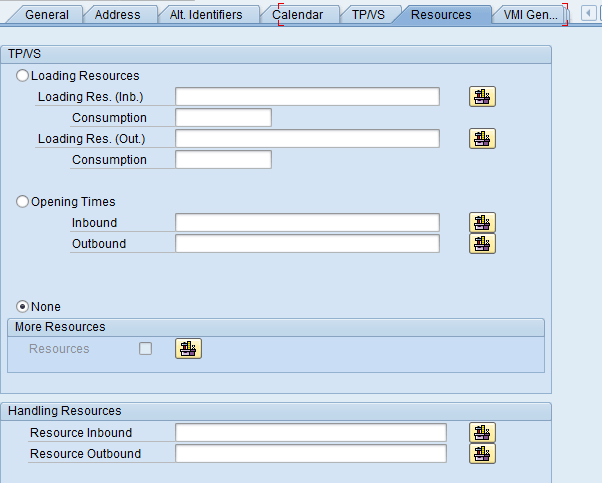
Figure 10
The Resources tab
Once the required details have been added, click the save icon. Once the location has been saved, click the back icon to return back to the main screen. Then click the Assign Model button (Figure 11) to assign the location to the active model as shown in Figure 11.

Figure 11
Assign the location to an active model
After you click the Assign Model button, a pop-up screen appears (Figure 12). Enter 000 in the Model Name field to assign the location to active model 000.

Figure 12
Enter a model name
After you enter 000 in the Model Name field, click the assign objects to model icon as shown in Figure 13 and then click the enter icon (the green check mark beside it).

Figure 13
Assign the object to the model
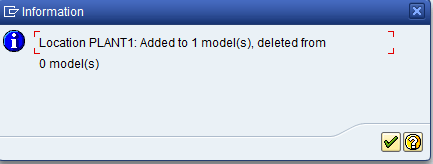
Figure 14
Location master data added to model successfully
Products
Figure 15
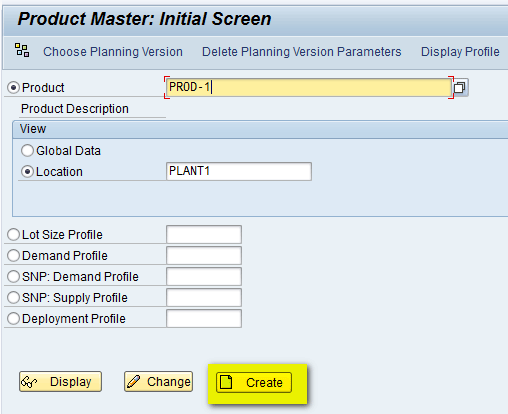
Figure 15
The Product Master initial screen
In the next screen (Figure 16), enter a description in the Prod. Descript. field (e.g., Product-1) and a base unit of measure in the Base Unit field (e.g., EA, which stands for each). Once these details are defined, you can go to different tabs and assign important parameters as needed.

Figure 16
The Product Master header screen
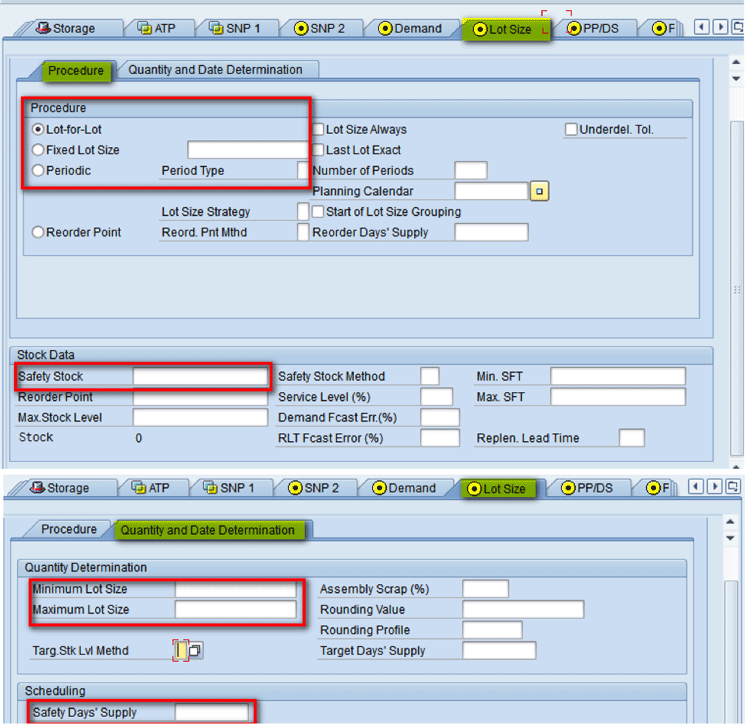
Figure 17
The Lot Size tab
In the Lot Size tab, there are two different tabs – Procedure and Quantity and Date Determination – in which different fields are defined. Other important fields here are Minimum/Maximum Lot size, which means that lot size of the individual orders cannot be smaller or greater than the given value. Safety Stock and Safety Days’ Supply can also be maintained in the Lot Size tab. This data specifies the number of workdays over which the system has to take into account future demands when planning safety stock. All these important fields have been highlighted in Figure 17.
In the Procurement tab, you populate the Procurement Type field. The procurement type helps in determining how a material is to be procured. In the Procurement Type field you can enter E for in-house production (as shown in Figure 18) or F for external procurement.

Figure 18
The Procurement tab
In the SNP2 tab as shown in Figure 19, assign the SNP Demand Profile and SNP Supply Profile, or if there aren’t any defined, then fill in the different horizons. SNP does not create any planned orders in the production horizon and stock transfers in the stock transfer horizon. These are the two important horizons which are used in SNP Heuristics. Along with this, one can also define safety stock and safety days’ supply in the Lot size tab if needed.
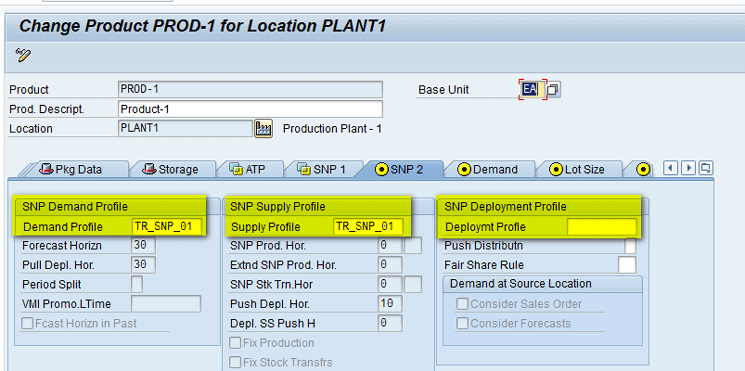
Figure 19
The SNP2 tab
Once the required details have been added, click the save icon. Once the product has been saved, click the back icon to return to the main screen. Then click the assign model icon to assign the location to the active model (Figure 20).
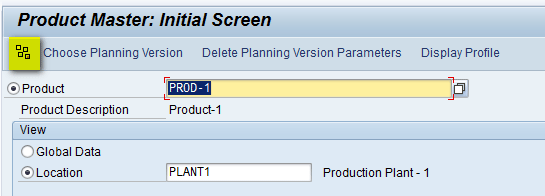
Figure 20
Assign the location to the active model

Figure 21
Enter a model name
After you select Model 000, click the assign objects to the model icon and then click the green arrow icon beside it as shown in Figure 22.

Figure 22
Assign the object to the model
Now you see a screen that displays a message indicating that the assignment is made correctly (Figure 23).
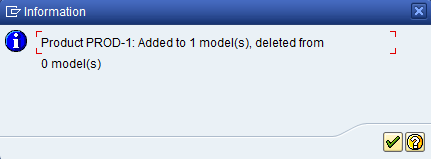
Figure 23
Product master added to the model successfully

Figure 24
Assign the product to a planning version
In the pop-up screen (Figure 25), enter 000 in the Plng Version field to assign the product to active planning version 000. Then click the enter icon (the green check mark).
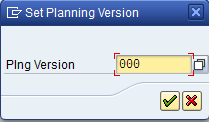
Figure 25
Assign the product to the active planning version
In the above steps, you created PROD-1 at PLANT1. Similarly, you need to create it at both the DC – DC01 and DC02. You also need to create product PROD-2 at PLANT1, DC01, and DC02.
Note
For simulation purposes, in this article I run the heuristics in active version only (000). You can also create a simulation version and have heuristics run in the simulation version. Version 000 is the active version and holds both master and transaction data. There may be some scenarios in which you want to simulate some proposal without affecting the actual business data; this can be achieved in simulation versions. One active version can have multiple simulation versions; however, all fields in the simulation version may not be available for maintenance.
Transportation Lane
Figure 26

Figure 26
The Transportation Lane initial screen
This action opens the screen shown in Figure 27. In the Means of Transport section, click the create icon. On the right side of Figure 27 note that truck is assigned to the Means of Trans. (means of transport) field. Note also the Aggr. Planning check box is selected as this field needs to be checked in order for SNP to take into consideration and consider it as a valid lane. In addition, I have selected the Valid for All Products check box to make this lane valid for both products. I also can define transport duration. After all the details are entered, click the enter icon (the green check mark) highlighted in Figure 27.
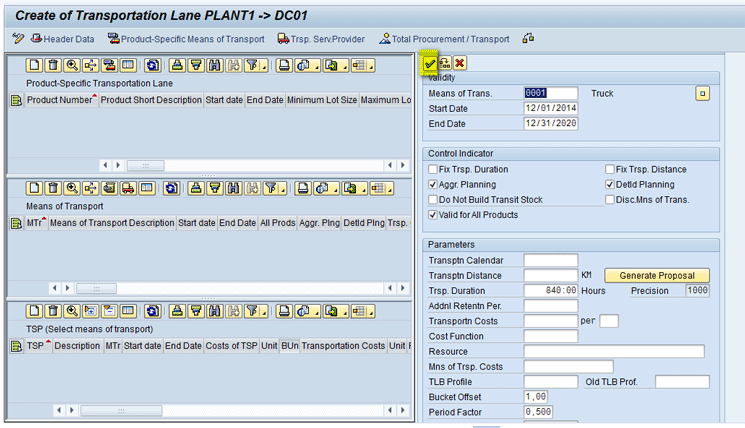
Figure 27
Create a means of transport
Select a product or products you want to assign to the lane and enter validity dates for these products in the Start date and End date columns. In my example, I select products PROD-1 and PROD-2 and assign them to this lane as shown in Figure 28. Note that it is important to define the validity dates for the product properly as these dates cannot be changed later. Therefore, it is important to define the end date accordingly for planning; otherwise, the planner would have to create a new product lane after the expiration of the old date.

Figure 28
Assign products to the lane
Click the save icon. You have now created the transportation lane. Similarly, you can follow the same steps as described above and create transportation lanes from PLANT1 to DC02 as shown in Figure 29.

Figure 29
The transportation lane
Resources
Resource master data is particularly useful for defining capacities (e.g., capacities of plants, machines, or warehouses) and resource-specific planning parameters in SNP, Production Planning and Detailed Scheduling (PP/DS), and CTM. In my example, I define bucket resources. SNP then uses bucket resources, as all the planning is going to be in period buckets.
After you execute transaction code /SAPAPO/RES01, the Resources screen appears. In this screen, populate the Resource, Location, and the Planning Version fields as shown in Figure 30. Then click the create icon beside the Resources button (the third button from the left).
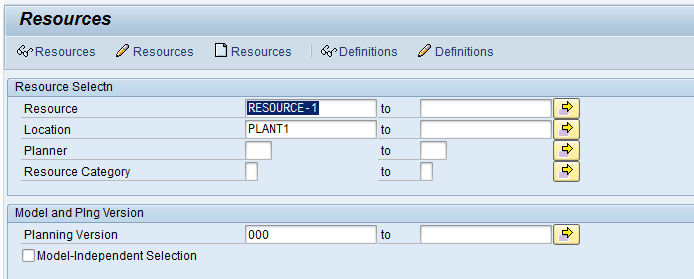
Figure 30
The Resources initial screen
In the 1 Bucket tab of the next screen (Figure 31), enter P (production resource) in the Res. Categ. (resource capacity) field. In this tab you can also assign a Factory Calendar.
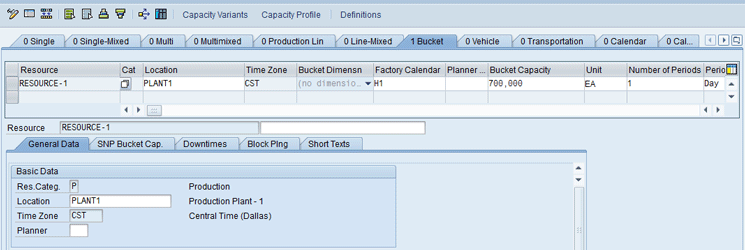
Figure 31
The 1 Bucket tab
In the next screen, click the SNP Bucket Cap. tab. Select an entry for the Period Type field (e.g., Day) and populate the other fields as shown in Figure 32. In my example, I entered a Bucket Capacity of 700 and a bucket utilization of 100 percent.
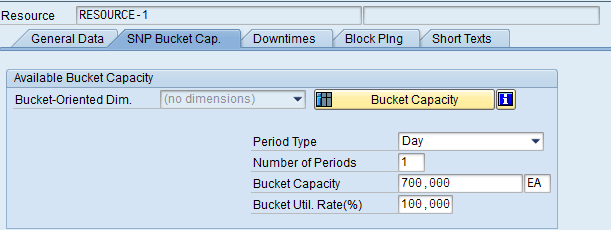
Figure 32
The SNP Bucket Cap. (capacity) tab
In the pop-up screen that appears (Figure 33), enter 000 in the Model Name field to assign the resource to Active Model 000. Click the assign objects to model icon and then click the enter icon (the green check mark).

Figure 33
Assign the resource to the active model
After you assign the resource to the model, the system automatically creates the resource for all planning versions in the system. You can click the Capacity Profile button in the Resource Master as shown in Figure 34.

Figure 34
The Capacity Profile button
Capacity Profile displays the bucket capacity definitions to validate the resource is set up correctly (Figure 35).
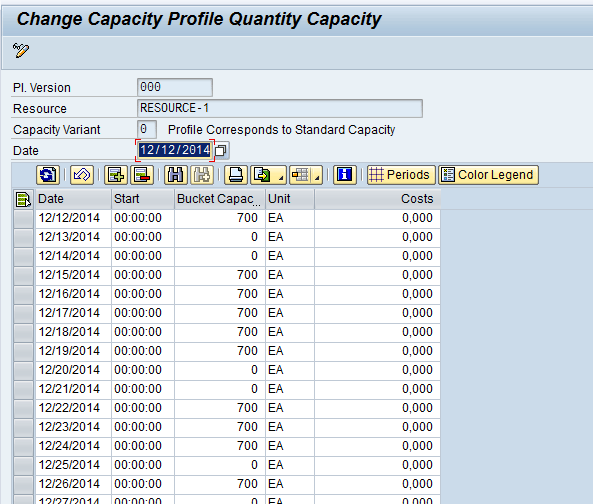
Figure 35
Capacity profile details
SNP plans in period buckets, so it aggregates the daily bucket capacity to calculate the total period capacity.
Note
In my example, I define daily bucket capacity of 700. This capacity would be used during capacity leveling.
Production Process Model (PPM)
To configure master data for a PPM, execute transaction code /SAPAPO/SCC03. This action opens the screen shown in Figure 36. In this screen, enter a name in the Plan field and click the Create button.
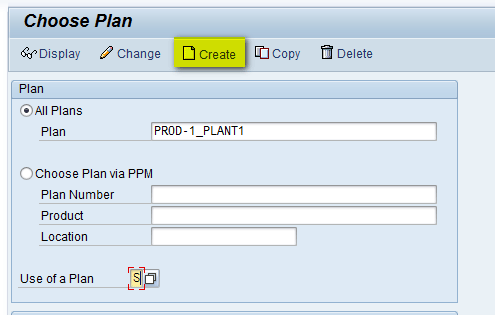
Figure 36
The production process model initial screen
In the next screen (Figure 37), enter a description for an operation (e.g., Car Assembly). The Operation Number column would be auto-populated with numbers (e.g., 0010 or 0020). Enter a description for 0010 and then double-click the operation number.
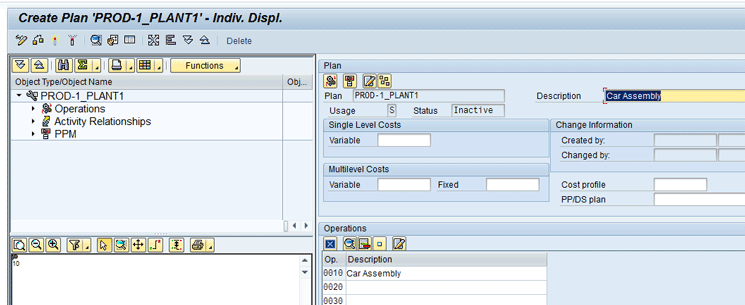
Figure 37
The production process model header screen
In the refreshed screen (Figure 38), enter a description for an activity (e.g., Assemble Car), activity type – P for produce. Double-click the activity number.

Figure 38
The production process model Activities section
In the next screen (Figure 39), you can enter the product that will be produced. The input/output type would be O for output product and I for input. This represents the BOM to produce the car. Enter a validity period for the production of the product. The units should always be EA, to match the units I set up in the bucket resource. The Variable consumption should always be 1 to represent consumption of 1 slot per car.

Figure 39
The production process model Components tab
Click the Mode tab (Figure 40). Enter a mode (e.g., 10) and enter the name of the bucket resource in the Primary Resrce (primary resource) column and the plant it will be built in under the Location column. Enter the unit as Day –all SNP orders look like they are a day long, as the objective is not to sequence the orders but to understand the consumption of capacity. Enter the fixed duration as 1.
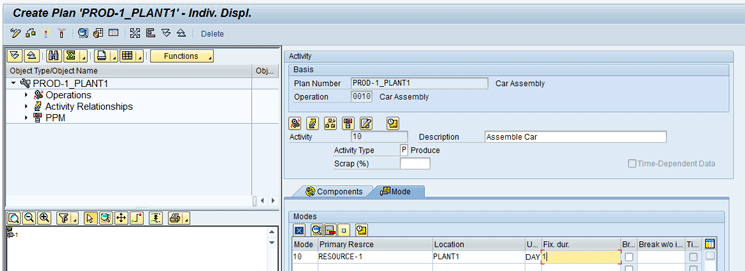
Figure 40
The production process model Mode tab
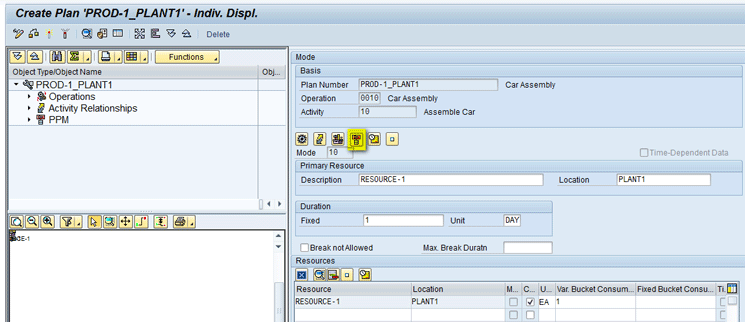
Figure 41
Product plan assignment in the production process model
In the next screen (Figure 42), enter the planning location and enter the same location for the production plant (e.g., PLANT1). When you scroll on the right, the field for Maximum lot size shows up. Enter a maximum lot size (e.g., 99999).
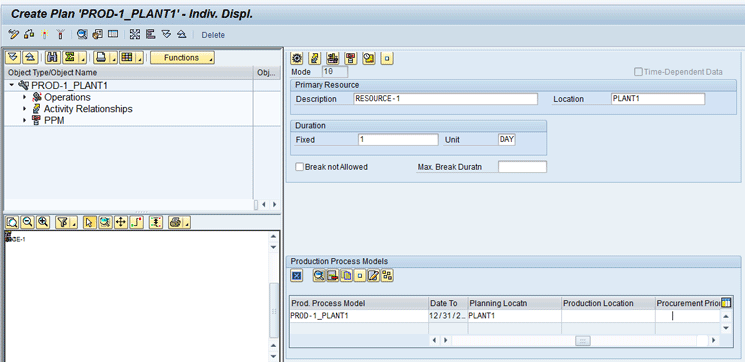
Figure 42
The product plan assignment details in the production process model

In the pop-up screen (Figure 43), enter 000 in the Model Name field to assign the PPM to model 000.
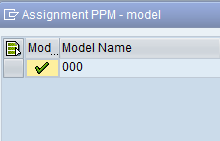
Figure 43
Assign model 000 to the PPM
After you assign the model to the PPM, click the activate icon as shown in Figure 44.

Figure 44
Activate the PPM
After activation, you see a message that validates that the PPM is set up correctly and made active and ready for use by SNP (Figure 45).
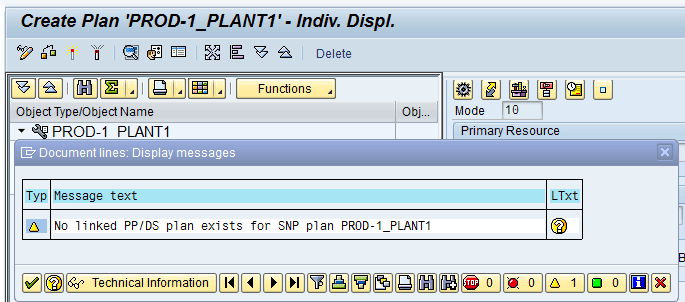
Figure 45
Message validating correct setup of the PPM
In addition, instead of creating a new PPM, you can copy an existing PPM and change the required details as needed. To complete this step, execute transaction code /SAPAPO/SCC03. In the Choose Plan screen (Figure 46), click the Copy button.
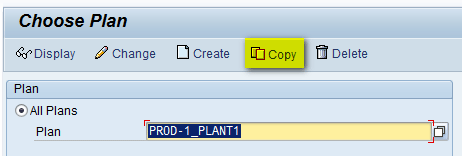
Figure 46
Copy the PPM
In the next screen (Figure 47), enter the name of the new PPM to be created.
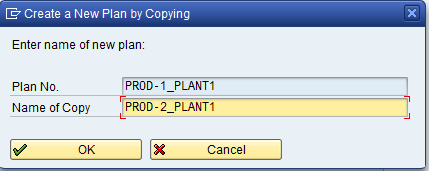
Figure 47
Create a new PPM using the copy option
This completes the setup of master data needed to execute SNP heuristics. Note that I have created all the master data manually in APO and assigned it to Active Model 000. However, this master data can also be created in ECC and then transferred to APO via CIF. The diagram in Figure 48 shows the mapping between master data objects between ECC and APO.
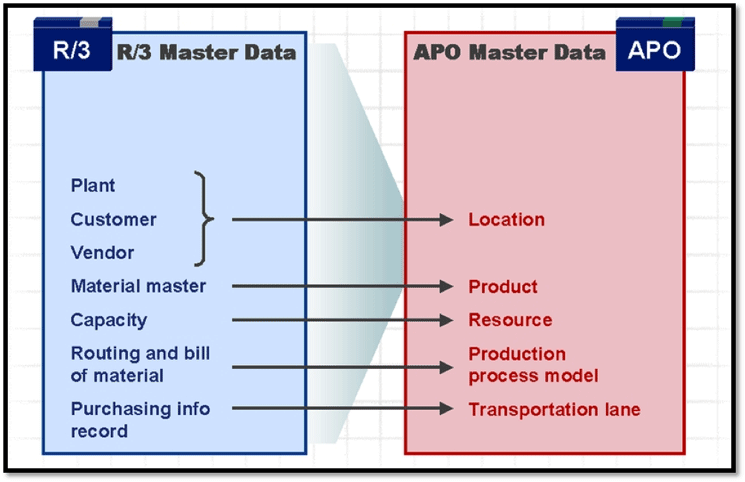
Figure 48
Master data mapping between ECC and SAP APO via the CIF
SNP Planning Book/Data View
Location Heuristics
Figure 5
Initially, you create demands for PROD-1 at location DC01 and DC02. In order to create Demands, execute transaction code /SAPAPO/RRP3. In the Product View screen (Figure 49), enter data in the Plng Version (planning version), Product, and Location fields.
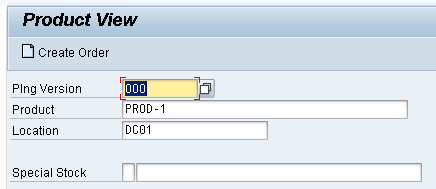
Figure 49
The Product View screen
In order to create demand, go to change mode by clicking the pencil icon (Figure 50).

Figure 50
Go to change mode
In next screen (Figure 51), enter a Demand of quantity 100 at DC01 (To create a demand enter a negative quantity of 100 for a future date and press Enter).
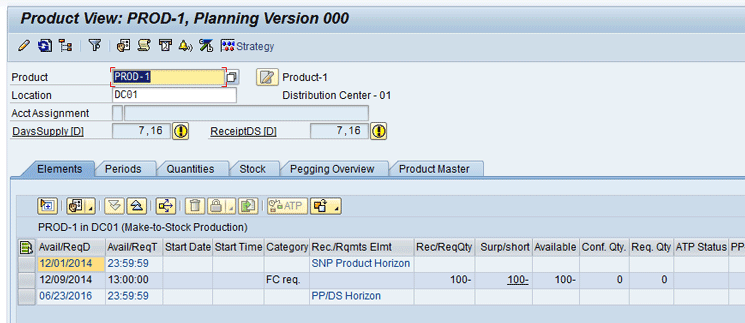
Figure 51
Demand at DC01
Similarly, you create Demand of quantity 200 at DC02 as shown in Figure 52.
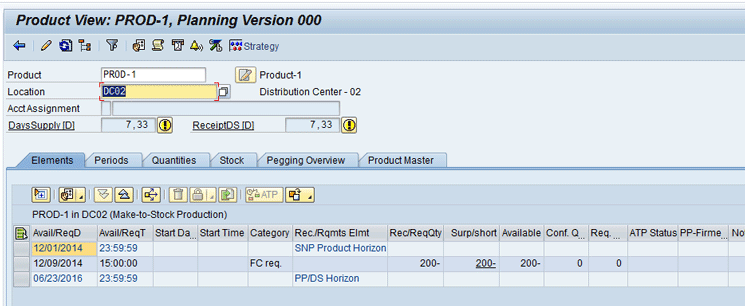
Figure 52
Demand at DC02
Now check in the SNP planning book to see how these are reflected. Execute transaction code /SAPAPO/SDP94. In the screen shown in Figure 53, select APO Location Product from the options available in the Show field. Enter data for PROD-1as shown in Figure 53. Click the green check mark icon.
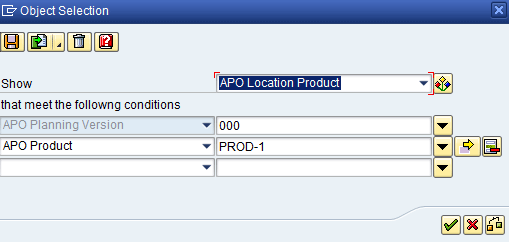
Figure 53
Load data in the planning book

Figure 54
Demand at DC01

Figure 55
Demand at DC02
In the change mode, click the Location button as highlighted in Figure 56 to run the location heuristic at DC01.
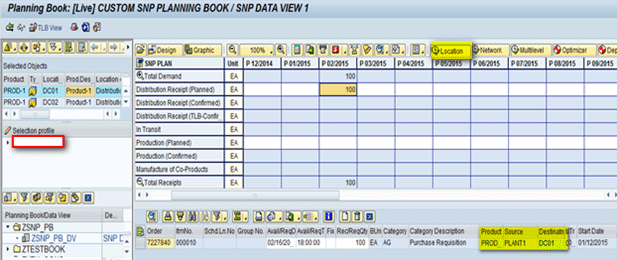
Figure 56
Location heuristic at DC01
Similarly, you run the location heuristic at DC02 as shown in Figure 57.
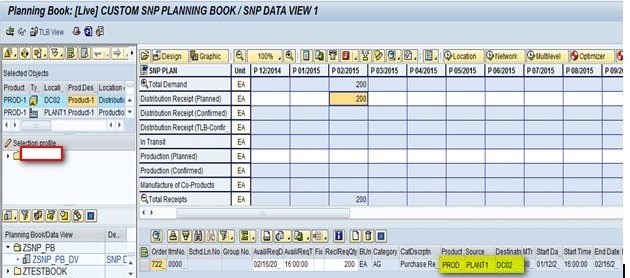
Figure 57
Location heuristic at DC02
After running the location heuristics, you can see that corresponding receipt elements (purchase requisitions) of 100 and 200 quantities at DC01 and DC02 have been created as shown in Figures 58 and 59. You can also see that the source of supply for both these is PLANT1.
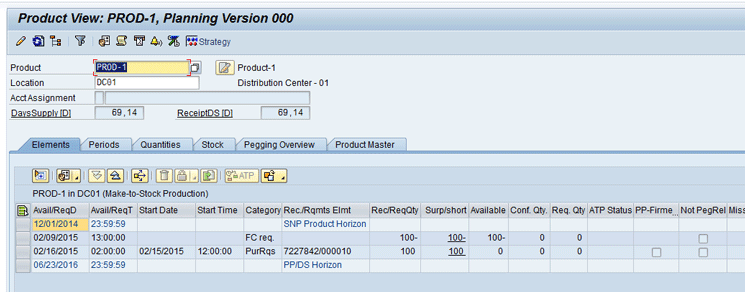
Figure 58
Receipt at DC01
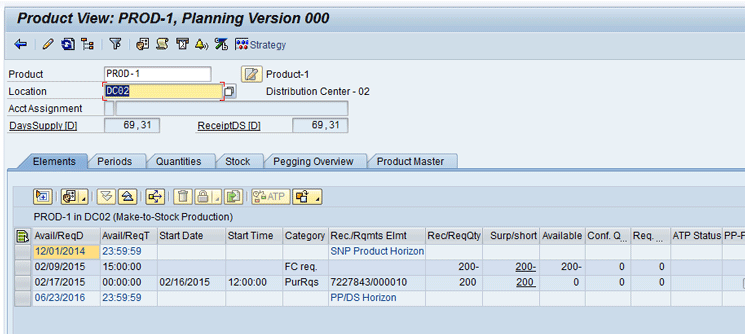
Figure 59
Receipt at DC02
You can also see at PLANT1 in the Product View screen (transaction code /SAPAPO/RRP3) that a purchase requisitions release (Demands) has been created with the same purchase requisition number as at DC01 and DC02 as shown in Figure 60.
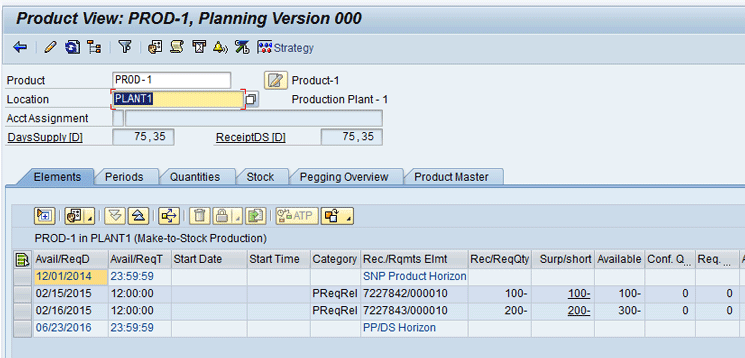
Figure 60
Demand at PLANT1 in the Product View screen
Now, in the interactive planning book in transaction /SAPAPO/SDP94, at PROD-1 PLANT1 level, you can see demand of 300 quantity (200+100 of each DC) is appearing as shown in Figure 61.
Now run the location heuristic at PLANT1 level and see the results as shown in Figure 62. Note that in order to run the Location Heuristics, you need to again go to change mode and then run Location Heuristics as explained earlier. This process is common and is used every time you need to run heuristics from the interactive planning book.
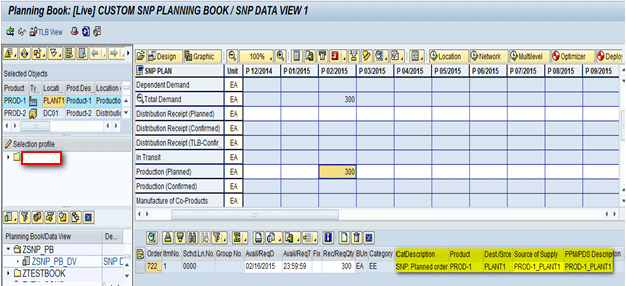
Figure 62
Location heuristic at PLANT1
After running Location Heuristics at PLANT1, you can see that the heuristic run has created SNP Planned Order of 300 quantities to fulfill the demand using the PPM at PLANT1 as shown in Figure 62. The same data is visible in the Product View screen (transaction code /SAPAPO/RRP3) also for PLANT1 as shown in Figure 63.
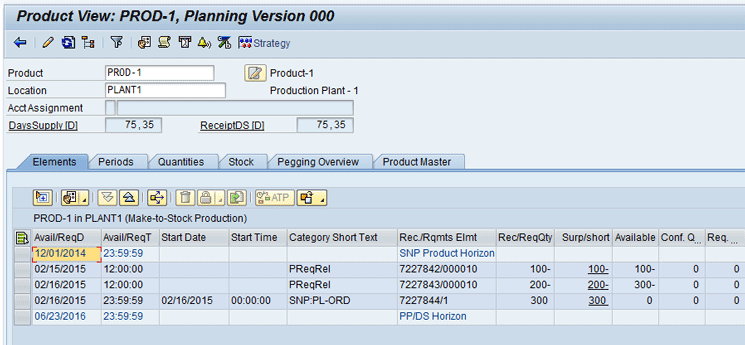
Figure 63
Receipt at PLANT1
Network Heuristics
Figure 5Figures 6465

Figure 64
Demand at DC01
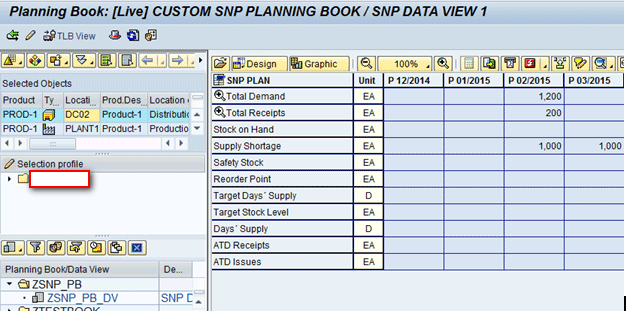
Figure 65
Demand at DC02
Note
Demands (forecasts) can be created via the Product View. To do this, execute transaction code /SAPAPO/RRP3 and complete the steps for the required product at the required location as described in the “Location Heuristics” section. You follow the same process in terms of going to the product view transaction and entering the forecasts at the respective DCs. This in turn is automatically reflected in the SNP planning book. In addition, instead of creating the demand (forecasts) in the Product View, users have the option to directly create the demands in the interactive planning book also by executing transaction code /SAPAPO/SDP94 for a required time period. Therefore, you can select either of these two options to create demand at the required location.
In order to run the network heuristic, you need to go into change mode in Interactive Planning and then run it. To go to change mode in the planning book, select the pencil icon as shown in Figure 65.
Figures 666768Figure 67Figure 67Figure 68
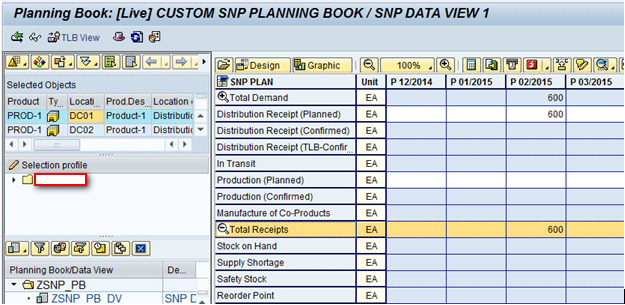
Figure 66
Receipt at DC01
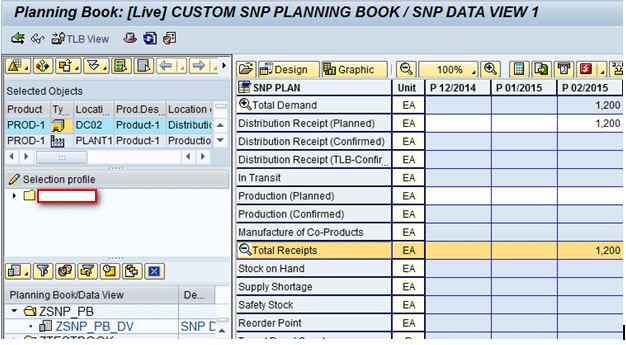
Figure 67
Receipt at DC02
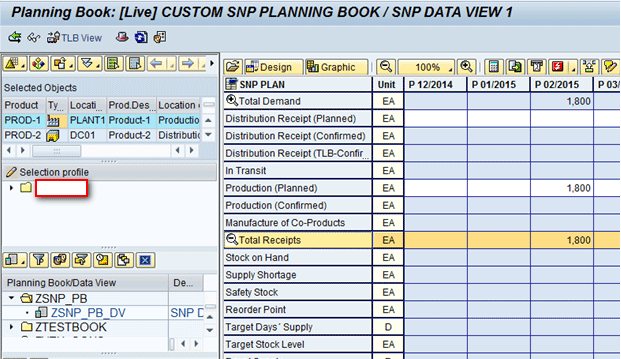
Figure 68
Receipt at PLANT1
Similarly, you can see the receipt (planned orders) created at PLANT1 in the Product View screen (transaction code /SAPAPO/RRP3) as shown in Figure 69.

Figure 69
SNP Planned Orders at PLANT1
Multilevel Heuristics
Here product PROD-2 has one BOM component, RAWMAT-1, in the ratio 1:2, so to make 1 quantity of PROD-2, two quantities of RAWMAT-1 are needed. You can see this in PPM in transaction /SAPAPO/SCC03 as shown in Figure 70.

Figure 70
PPM showing BOM components for PROD-2
Again, for Multi-Level Heuristic you use the same supply chain network as shown in Figure 5. Here you use PROD-2 for simulation purposes as it has BOM components. Initially, demand is created for PROD-2 at both the DCs (DC01 and DC02).
Note
You can create demands (forecasts) via the Product View screen (transaction code /SAPAPO/RRP3) for the required product at the required location as shown in the “Location Heuristics” section. This would, in turn, be automatically reflected in the SNP planning book. Demand created at DC01 is 100 and demand created at DC02 is 200 for PROD-2.
Figures 7172
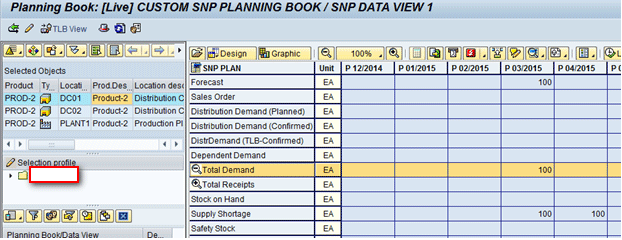
Figure 71
Demand at DC01 for PROD-2

Figure 72
Demand at DC02 for PROD-2
Now you run a multilevel heuristic at DC01. Note again for running a multilevel heuristic, you need to go into change mode in the interactive planning book as discussed earlier in the “Location Heuristics” and “Network Heuristics” sections. To run the multilevel heuristic, you click the Multilevel button as shown in Figure 73.

Figure 73
Running a multilevel heuristic
After running the Multilevel Heuristic at DC01, you can see that it created receipt elements at all the DCs and the plant as well. Also, since you had one BOM (RAWMAT-1) for this product, a receipt element would be created for this too. Receipt created at DC01 is 100 as shown in Figure 74, receipt created at DC02 is 200 as shown in Figure 75, Receipt (planned orders) created at PLANT1 is 300 (100+200) as shown in Figure 76 and Receipt created at PLANT1 for RAWMAT-1 is 600 (300*2) as shown in Figure 77.
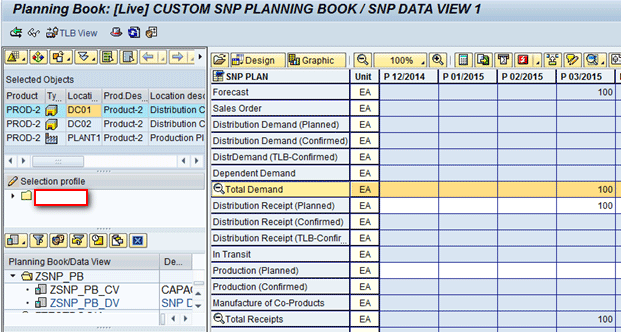
Figure 74
Receipt at DC01
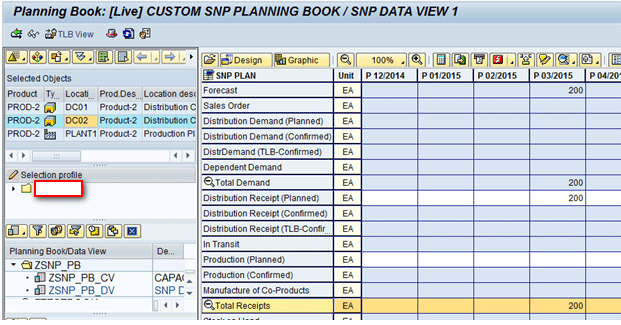
Figure 75
Receipt at DC02
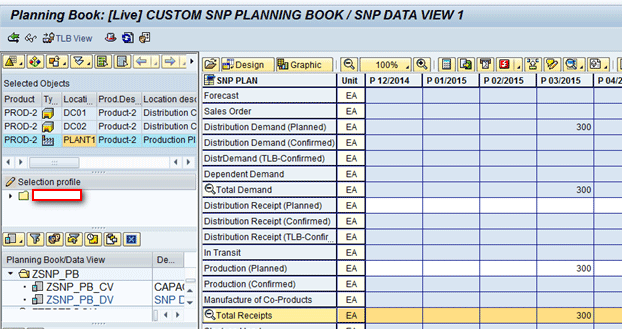
Figure 76
Receipt at PLANT1 for PROD-2
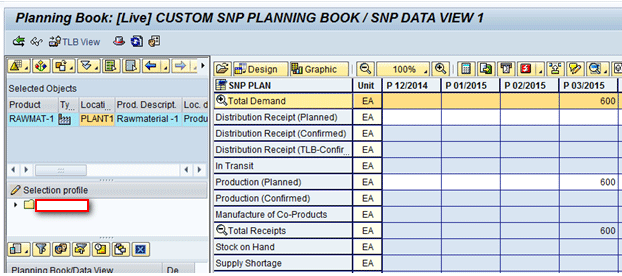
Figure 77
Receipt at PLANT1 for RAWMAT-1
Running Heuristics in Background
Instead of running heuristics interactively, there is another option to run it in the background via transaction /SAPAPO/SNP01 as shown in Figure 78. This is also useful when you are planning for a large number of products. Also here, users have the option to either give manual selection for products and location or they can use the selection profile that was created in the interactive planning book.
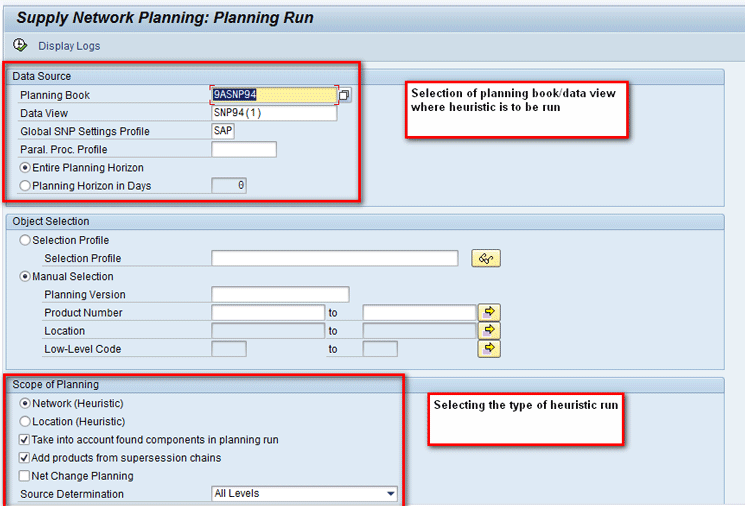
Figure 78
Running heuristics in background mode
Low-Level Code Determination
As discussed earlier, low-level code is used by the system to internally determine the correct planning sequence. This can also be executed via transaction /SAPAPO/SNPLLC as shown in Figure 79 by giving the required parameters for the product, location, and planning version. If you select the Whole Model option, then the system calculates low-level codes for the entire planning model. However, if you select the Temporary LLC Determination option, then the system calculates low-level codes for only a specified set of master data as given in the selection parameters.
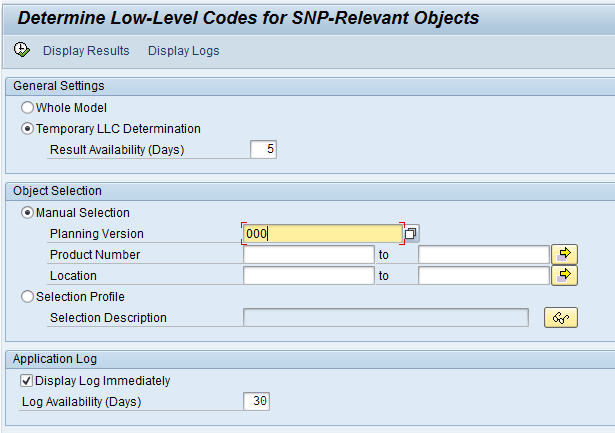
Figure 79
SNP low-level code determination
Capacity Leveling
In this supply chain network as shown in Figure 5, if you increase the demands at both the DCs, this would result in more planned orders being generated at the plant level (PLANT1) as shown in Figure 80.
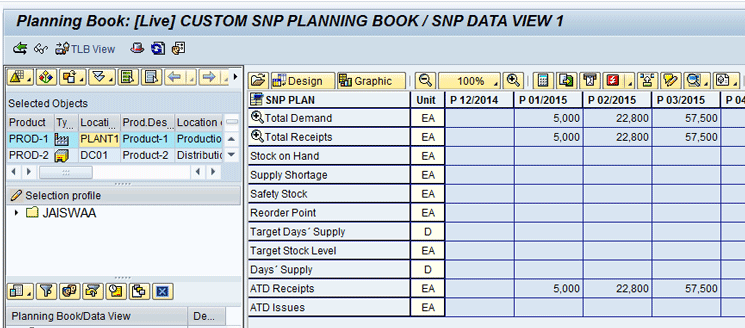
Figure 80
Demand and receipt situation at PLANT1
Note
You can create demands (forecasts) via the Product View screen (transaction code /SAPAPO/RRP3) for the required product at the required location as shown in the Location Heuristic discussion. This would in turn be automatically reflected in the SNP planning book.
Now if you look at the capacity view planning book as shown in Figure 81, you can see if the plan is greater or less than available plant capacity and by how much.
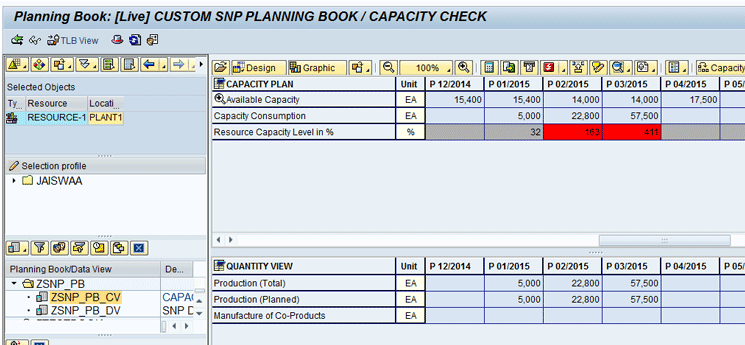
Figure 81
Capacity view at PLANT1
Note
In my example, capacity in January = 15,400 (22 working days)
Capacity in February = 14,000 (20 working days)
Figure 81
Here the planner can run capacity leveling to level out the load across the periods to make the plan feasible. To run the capacity leveling, click the Capacity Leveling button (Figure 82).

Figure 82
Run Capacity Leveling
The heuristics-based leveling method compares the capacity load on the resource against the actual load for each period. Direction of comparison depends on the scheduling direction that has been selected as shown in Figure 83 (forward or backward scheduling). Once the system finds that the resource is overloaded, it selects all orders that are causing the overload in the particular period and then sorts these orders based on the priority defined, then moves them into subsequent or previous periods until the maximum resource capacity is reached. If no priority is defined in the profile, then a random priority is determined by the system automatically.

Figure 83
The Capacity Leveling profile
In my discussion in this article, scheduling direction is both forward and backward, so the overloaded quantity would be distributed in both directions. The result after running Capacity Leveling is as shown in Figure 84. Here you can see now that capacity utilization is not more than 100 percent in any of the periods, thereby generating a feasible plan.
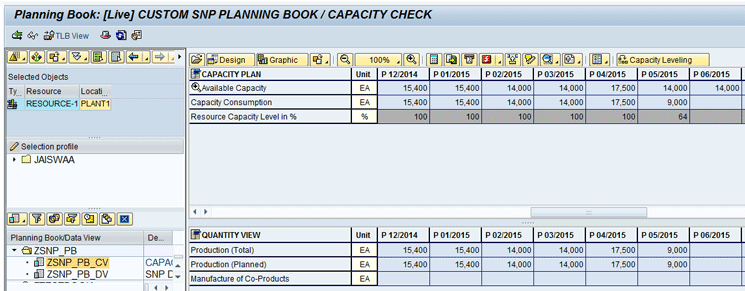
Figure 84
Capacity Leveling results
Now, instead of scheduling the direction as forward and backward, if you choose only forward in the capacity leveling profile as shown in Figure 85, the results would vary as shown in Figure 86.
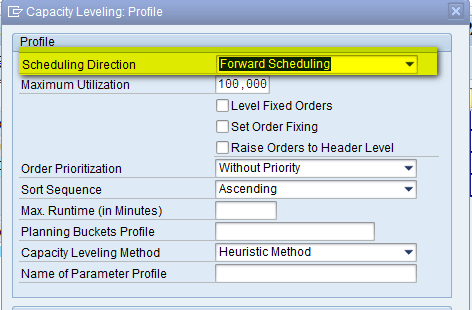
Figure 85
Forward scheduling in the Capacity Leveling profile

Figure 86
Capacity Leveling results
Table 2 is a comparison of heuristics, CTM, and the optimizer.
| |
Heuristic |
Capable-to-match (CTM) |
Optimizer |
| Overview |
Rapid infinite planning method |
Rules-based prioritization algorithm |
Objective is to create planning result with minimum cost and maximum profit. |
| Run-time performance |
Fastest |
Second fastest |
Slowest, most complex |
| Constraints |
No constraints – Plans on infinite basis |
Selects the first feasible solution based on constraints |
Selects the best cost-effective solution |
| Pegging |
Quantity based |
Order based |
Quantity based |
| Implementation |
Easy – Few control parameters |
CTM profile and master data important.
Planning more complex. |
Complex – Cost maintenance |
Table 2
A comparison of heuristics, CTM, and the optimizer
Alok Jaiswal
Alok Jaiswal is a consultant at Infosys Limited.
He has more than six years of experience in IT and ERP consulting and in supply chain management (SCM). He has worked on various SAP Advanced Planning and Optimization (APO) modules such as Demand Planning (DP), Production Planning/Detailed Scheduling (PP/DS), Supply Network Planning (SNP), and Core Interface (CIF) at various stages of the project life cycle.
He is also an APICS-certified CSCP (Certified Supply Chain Planner) consultant, with exposure in functional areas of demand planning, lean management, value stream mapping, and inventory management across manufacturing, healthcare, and textile sectors.
If you have comments about this article or publication, or would like to submit an article idea, please contact the editor.


