Boolean operators like AND, NOT, and OR give a calculated key figure the ability to perform different calculations depending on other results or values. The author explains how Boolean functions works and shows how you might use them to enhance reports.
Have you ever wondered how you could place some kind of mechanism in your reports to force BW to make decisions on the fly? Puzzled? Let me rephrase the question. Have you ever wondered how to make a calculated key figure perform different calculations depending on other results or values presented on the same report?
Let’s say you are looking for a way of applying “IF...THEN” statements to your report logic. For example, imagine that you have a report that presents actual revenue against planned discounts. The planned discounts are calculated based on the total revenue per customer. If a customer provides you with revenue of less than $100,000, then the discount applied should be 5 percent of the total revenue. If the revenue is between $100,000 and $1 million, then the discount should be 10 percent. If the revenue is more than $1 million, then the discount should be 15 percent. It might look like this:
| Customer |
Total Revenue |
Planned Discounts |
| A |
$95,000 |
$4,750 |
| B |
$200,000 |
$20,000 |
| C |
$50,000 |
$2,500 |
| D |
$2 million |
$300,000 |
In this case, the calculated key figure “planned discounts” is not just the single mathematical operation “total revenue times percentage.” It is necessary first to determine the actual total revenue for each customer and then apply the corresponding percentage. The required logic would be:
IF Total Revenue < 100 K THEN (Total Revenue * 5%)

IF 100 K <= Total Revenue <= 1,000 K THEN (Total Revenue * 10%)

IF Total Revenue > 1,000 K THEN (Total Revenue * 15%)
How do you incorporate this logic? By using Boolean functions, of course. Boolean functions can introduce a whole new perspective to reporting operations, maximizing the analytical potential and enhancing existing reports by providing new ways of combining calculated key figures or even creating new ones. Unfortunately, Boolean functions are not well known by many report developers. I’ll show you how to use them with a few simple examples.
So How Do You Use the Boolean Functions?
BW provides Boolean operators that represent a method of comparison between numerical values or mathematical validation by using true/false combinations. If a statement created with a Boolean operator is “true,” then the value returned by the system on this statement equals “1.” If the statement is “false,” the value equals “0.”
Using a Boolean operator, you can create many statements and combine them into one calculated key figure. This simple concept allows many equations to be created to maximize the analytical potential of your report. Table 1 lists the Boolean operators available in SAP BW.
| Boolean Operator |
Description |
| Logical AND |
IF (Revenue>100K AND Quantity>1000 units) THEN discount is 5%.
All arguments shall be TRUE for result 1. In this case, revenue and quantity must exceed their thresholds to make the 5 percent discount applicable.
|
| Logical OR |
IF (Revenue>100K OR Quantity>1000 units) THEN discount is 5%.
At least one of the arguments shall be TRUE for result 1. In this case, revenue, quantity, or both arguments at same time could exceed its respective threshold to make the 5 percent discount applicable.
|
| Logical Exclusive OR |
IF (Revenue>100K NOR Quantity>1000) THEN discount is 5%.
Just one of the arguments shall be TRUE for result 1. More than one argument being TRUE gives result 0. In this case, the 5 percent discount would be applicable in only two scenarios:
1. Revenue is over 100K and quantity is under 1,000 units
2. Revenue is under 100K and quantity is over 1,000 units
|
| Logical NOT |
NOT (Quantity==2500).
This case is also described as a reverse argument. Without the NOT operator, the result of this expression would be true when quantity equals 2,500. However, as you are also applying the reverse argument NOT, all true arguments are then reversed, becoming false.
|
| == |
(Quantity==1000)
Mathematical operator “is equal to” |
| <> |
(Quantity<>1000)
Mathematical operator “is not equal to” |
| > |
(Quantity>1000)
Mathematical operator “is greater than” |
| >= |
(Quantity>=1000)
Mathematical operator “is greater than or equal to” |
| < |
(Quantity<1000)
Mathematical operator “is less than” |
| <= |
(Quantity<=1000)
Mathematical operator “is less than or equal to” |
| Table 1 |
Boolean operator definitions |
As mentioned before, Boolean operators can be combined in many ways into the definition of one or more calculated key figures. To show you how, I’ll use the example mentioned earlier where the calculated key figure “planned discount” should be built using a combination of Boolean operators. First, go to Query Builder. In my example, I already have a Total Revenue operand (Figure 1) in the Columns area.

Figure 1
Go to Query Builder to begin creating a Boolean statement. Type the Boolean statement into the formula editor.
Start by creating a new formula (calculated key figure) to represent the Planned Discount column. In the formula editor, build the first Boolean statement by typing it into the Edit Formula area shown in Figure 1.
(Total Revenue<100000)*Total Revenue*0.05
You may drag and drop Total Revenue from the Operands area into the Edit Formula window if you prefer.
The equation is now comprised of one Boolean statement (Total Revenue<100000) times another simple operation (Total Revenue*0.05). To review the Boolean concept using this formula, look at this statement:
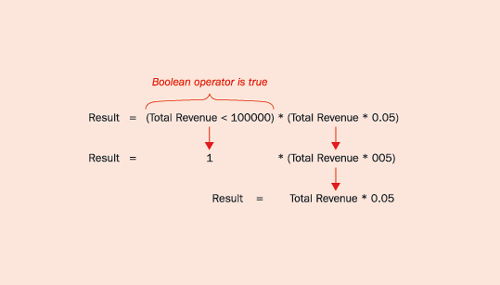
In the case that the statement is FALSE (i.e., total revenue is not less than $100,000), the value returned is zero. This forces the result as well to be zero (multiplication by zero).
To complete this formula, take the following steps to combine other Boolean statements and operations into the calculated key figure. First, add a plus sign followed by an open parenthesis to start a new Boolean statement. This time, you use two Boolean operators to represent the interval between 100,000 and 1 million. Type in the value 100000 followed by the Boolean operator >= (is greater than or equal to) followed by the Total Revenue key figure. Then enter the Boolean operator < (is less than) followed by the value 1000000 and an end parenthesis. Add another multiplication sign followed by Total Revenue*0.10. Add the last Boolean statement using the same principle:
+(Total Revenue>=1000000)*Total Revenue*0.15
The final formula should look like the one in Figure 2.

Figure 2
The completed Boolean statement to determine customer discounts
Let’s analyze the Boolean concept of this final formula. The example is of a customer with sales revenue greater than 1,000,000. In this case, Boolean statements one (Total Revenue < 100,000) and two (100,000 <= Total Revenue < 1,000,000) are both FALSE. The system then returns zero for both statements:

Notice that the result carried to the report represents the correct percentage (15 percent) based on total revenue greater than $1 million. The other values are canceled due to multiplication by zero. Within the formula, the Boolean statements are prioritized, followed then by the regular sequence of power among the mathematical operators—multiplications and divisions first, additions and subtractions later.
Boolean operators present no major performance issues as they work like any other simple calculation embedded into a calculated key figure. This means that they use the data presented on the query cache—in other words, the data already retrieved from the database server and stored temporarily on the application server.
This simple exercise illustrates the potential of BW Boolean operators. Try your own examples. I’m sure you will find many other combinations and solutions!
Christian Savelli
Chris Savelli, senior manager at COMERIT, has been dedicated to SAP BI and Analytics projects since 1998. He holds multiple SAP certifications covering HANA, BW and ECC applications and has expertise in managing all aspects of the information creation process, utilizing SAP BI technologies to satisfy strategic, analytical and reporting needs. Chris Savelli started his career at SAP and subsequently held senior level positions at consulting companies Deloitte and Accenture. His education background includes a bachelor of science degree in robotics and a master of science degree in engineering both from the University of Sao Paulo, as well as a post-graduate diploma in business administration from the University of California at Berkeley.
You may contact the author at csavelli@comerit.com.
If you have comments about this article or publication, or would like to submit an article idea, please contact the editor.