Jereme Swoboda provides a quick list of tips and tricks to help you get the most out of Solution Manager 7.1 Technical Monitoring. This list is based on Solution Manager 7.1 Support Package 10.
Key Concept
Technical Monitoring is designed to provide alerts on the critical components of your SAP landscape, allowing you to respond quickly to urgent situations that need immediate attention. Alerts are provided on four levels: Host, database, central instance, and dialog instance. Each level is considered a managed object. The alerts are further divided into four categories: Configuration, availability, performance, and exceptions.
As of Solution Manager 7.1 Support Package 10, Technical Monitoring is divided into five specific types of monitoring: System monitoring, Solution Manager self-monitoring, end-user experience monitoring, interface and PO monitoring, and job and BI monitoring. This article focuses specifically on system monitoring, although some of the tips can be used with the other types of monitoring.
To get the most out of this article, it is important to understand how system monitoring is managed. The configuration of system monitoring has a step called Template Maintenance. Within that step, managed objects are divided into four different types of templates: Host, database, technical instance (dialog instance), and technical system (central instance). These templates are broken down even further into metrics and alerts. A metric determines the actual data that is monitored and the threshold at which an alert needs to be sent. The alert determines who is alerted when the metric exceeds its designated threshold, and multiple metrics can be assigned to one alert.
Technical Monitoring is an extremely dense tool provided by SAP’s Solution Manager 7.1. It allows you to monitor almost anything. The following 10 tips help you manage and use the monitoring infrastructure to its fullest potential.
Tip #1: Assign Each Managed Object its Own Unique Template
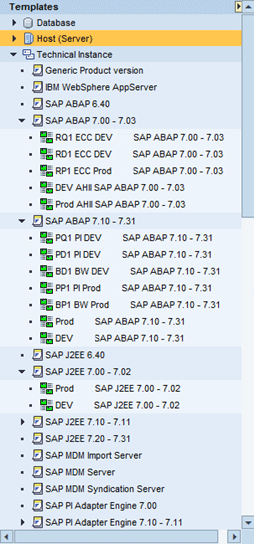
Over time, you will find that each managed object requires its own custom metrics and alerts, as they don't all match up with the needs of other managed objects. Assigning each managed object its own unique template allows you to keep these different metrics and alerts separate from other managed objects. Figure 1 shows an example of the available templates for different SAP systems and to which custom template the objects can be assigned based on whether they are non-production or production.

Figure 1
An example of creating a custom template for each managed object
Tip #2: Create the Production Template First
Customizing all the templates required for your SAP landscape can be very time consuming. Your production templates require more customization than your non-production templates. Therefore, it is best if you first create a template for each production-managed object, and then customize this template to meet all of your organization's different requirements. Then, later on, you can copy those templates for use with the non-production-managed objects.
Tip #3: Create a RACI Matrix for Assigning Alerts to Specific Teams or Employees
A RACI (Responsible, Accountable, Consulted, Informed) Matrix is a document that maps out who is responsible for what (Figure 2). Sending alerts to specific people ensures that only employees with the required authorization and knowledge receive the alerts to which they are responsible for responding. Over time, the repeated sending of alerts to people who aren’t responsible for a specific managed object or alert can cause people to start ignoring alerts. As a result, this bad habit causes slower response times for serious alerts.

Figure 2
A sample RACI Matrix
Tip #4: Deactivate Alerts That Are Not Required
Solution Manager 7.1 allows for the deactivation of the email alert while still collecting the data on the specific alert. This allows you to use the historical data to investigate issues, without the need to send the email alert. Many alerts do not meet the specific needs of your SAP landscape; if you find this to be the case, deactivate the email alert. Many organizations do not require all of the provided alerts for development and quality systems. If your organization does not require alerts on non-production systems, deactivate the alerts. Much like in Tip #3, repeatedly receiving alerts that do not require a response causes people to start ignoring alerts. This creates issues when real or serious alerts are sent, but are disregarded or are responded to late because of alert fatigue.
Tip #5: Be Proactive When False Alarms Are Received – Customize a Metric When Necessary
All the Technical Monitoring metrics have preset defaults out of the box. Some of these defaults work just fine with your system, but many do not. When the default metric thresholds do not match up with your organization’s specific requirements, you will receive a multitude of false alarms from Solution Manager. It takes time to eliminate all the false alarms that are sent by Solution Manager. Any time you receive an alert that turns out to be a false alarm, either keep a record of it or immediately customize the threshold, by either increasing the threshold or decreasing it. Staying on top of these false alarms and adjusting the metric thresholds is required to eliminate false alarms.
Tip #6: Take the Time to Create and Assign Work Mode
The SAP system provides the ability to create work modes. Work modes allow you to schedule planned maintenance and downtime. This allows you to avoid false alarms by assigning a work mode to a specific alert. For example, if you create a planned downtime work mode and assign it to an availability alert, system monitoring does not send an alert when it detects the managed object is not running during that specific time frame designated within the work mode.
Tip #7: Create a Custom Metric When a Standard Metric that Meets Your Requirements Is Not Provided
Occasionally, you may need an alert that SAP has not provided. There are two ways to achieve a custom created metric. The first method is to use Computing Center Management System (CCMS) within the managed object. System monitoring allows you to create a metric that can pull the current status of a CCMS monitoring tree elements (MTE). The second way is to create a custom data provider. A data provider is the tool that a metric uses to pull data. To create a custom data provider, cut and paste the following URL into your browser: https://<SolManFQDN>:80<Instance_Number>/sap/bc/webdynpro/sap/WD_MAI_DPC_MAIN. This opens the Data Collector Template creator (Figure 3), which allows you to create a custom data provider for a custom-created metric.

Figure 3
Create a Custom Data Collector Provider
Tip #8: Send Alerts to Distribution Lists
Adding and removing people from all the different alerts can be a time-consuming process. Using distribution lists effectively saves you precious time. It is much easier to remove or add people from the distribution lists within your email exchange than it is to remove them from all the different alerts for all managed objects. First, create a distribution list for each technical team within your organization. Then add that distribution list to the alerts that should be sent to that distribution list.
Tip #9: Use Mobile Applications
SAP provides a number of mobile applications for both Android and Apple iOS mobile devices. Specifically, these apps are for system monitoring and end-user experience monitoring. These mobile apps give you the ability to remotely check on the current status of all metrics and confirm alerts when required. Mobile applications are a quick way to increase the response time to important issues. All SAP’s mobile applications can be downloaded from the mobile application store of your specific mobile device operating system. Figures 4 and 5 show screenprints of the system monitoring applications for the Apple iOS and Android OS devices.

Figure 4
System monitoring mobile application for the Apple iOS

Figure 5
System monitoring mobile application for the Android OS
Tip #10: Regularly Check for Updates to the System Monitoring Content
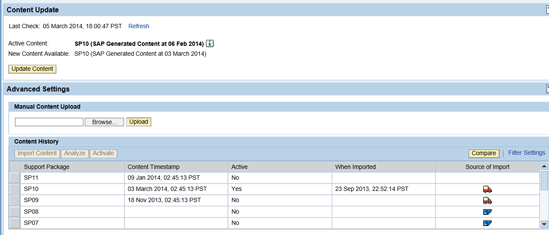
SAP releases new system monitoring content on a regular basis. This content provides new alerts and metrics with new functionality for your alerts. The update process is done in Step 2.7, Update Content, in the System Monitoring Configuration guided procedure. When updating, make sure to use the compare and analyze tool to determine if any custom alerts are affected by the change (Figure 6).

Figure 6
Update content within the System Monitoring Configuration guided procedure
Jereme Swoboda
Jereme Swoboda is an experienced SAP Solution Manager and NetWeaver consultant focusing on proactive technical monitoring of SAP and non-SAP systems, supporting critical business processes. He has tremendous experience pairing real-world scenarios with Solution Manager’s Technical Monitoring capabilities. He is an expert at collecting requirements, creating a monitoring strategy, and then putting that strategy to work for SAP customers. Jereme has had the opportunity to work on a variety of platforms for companies large and small integrating Solution Manager 7.1.
You may contact the author at jereme.swoboda@benimbl.com.
If you have comments about this article or publication, or would like to submit an article idea, please contact the editor.


