Learn how SAP Payroll Change Management can simplify and reduce errors in your payroll runs.
Key Concept
SAP introduced a new product, Payroll Change Management, in March 2006. This tool works with R/3 4.6C and up. It takes a historical snapshot of your payroll configuration so you can track the changes you made in detail. Based on the historical information, payroll technical staff can pinpoint and correct an error.
Let’s say that you just completed your payroll configuration changes to adjust vacation accrual policy, but you cannot get the results quite right and you forgot the exact changes you made. How can you get payroll to run correctly?
SAP Payroll Change Management helps you analyze the impact of your changes by pointing out the schemas, rules, and wage types that reference the configuration settings you changed. A summary screen highlights inconsistencies and provides an enhanced payroll run analysis that focuses on the payroll steps that changed the vacation accrual wage types. This enables you to examine how relevant rules process the wage types.
Note
More detailed information about the tool, including information about its benefits, system requirements, installation, licensing, and a free 30-day trial is available at
https://sdn.sap.com. Go to the
Business Process Expert Features section in the lower right side of the page and select
SAP Payroll Change Management Add-on. This article expands on the instructions in the SAP Payroll Change Management Installation and User Guide on the SDN Web site.
Overview of Features
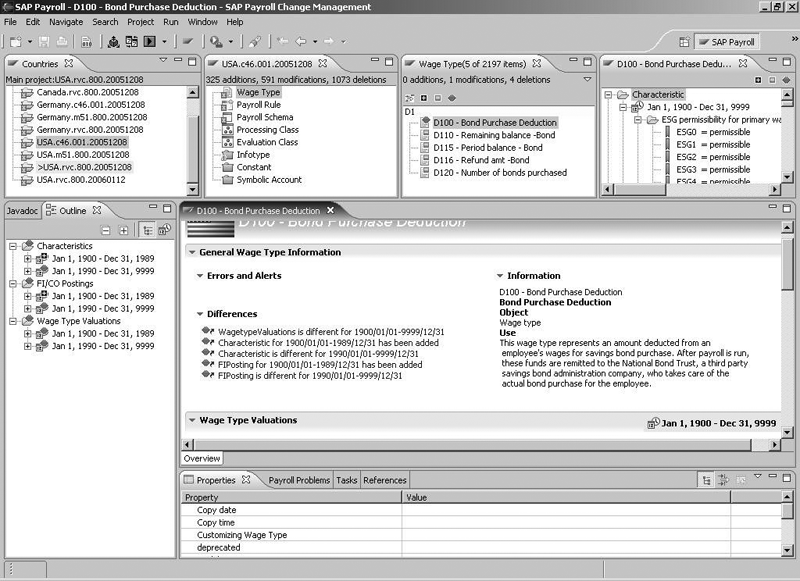
Figure 1 shows the central screen for SAP Payroll Change Management. When applying Support Packages, you must ensure configuration changes that go into production instances are correct. You can use Payroll Change Management’s compare feature to see snapshots of the same instance over time. You also can compare your test, production, and development instances or instances that you plan to consolidate, as well as different versions before or after upgrading or applying a Support Package.

Figure 1
Payroll Change Management GUI with navigation guide
The impact analysis feature displays all references, including cross references, to a selected payroll object (such as wage type tables, rules, and processing classes). This view enables you to see how changes affect your payroll configuration. The first step is to find all the payroll configuration objects that refer to the changed object. Secondly, the tool cross-references these so that you can check them in one place. Thirdly, when checking the impact of changes, the tool provides all necessary documents in context to speed up the analysis.
Have you ever forgotten to correct placeholder Financials Accounting (FI) posting symbolic accounts until after they cause trouble in posting? Payroll Change Management catches them before you start the test runs with its configuration error detection and reporting. R/3 permits you to make errors: For example, you may insert placeholder symbolic accounts, use non-existing rules, and reference country-specific rules for different countries. These mistakes are easy to fix but difficult to spot. The tool locates and summarizes errors so that you can correct them before running payroll.
Payroll Change Management includes a payroll log that you can use to analyze your payroll driver data. The log notes changed tables for each payroll processing step. You also can examine wage types in every step of payroll via Wage Type Explorer, which works offline.
To appreciate how the tool improves payroll operations, it helps to compare the efforts needed to achieve the same capabilities using current tools. For example, to find all the references to processing class 6 in an R/3 4.6C system, you would have to inspect all possible rules and schemas manually. In addition, to locate all the processing steps that change a wage type throughout the entire payroll run, you would have to go through the log trace manually, checking all traced tables that may have stored the wage type for every processing step. To track the calculation details of a rule in a payroll run, Payroll Change Management uses an interactive log replay to drill down to the rule details, which is impossible using the current log trace.
Note
Users should contact their SAP license representative for more information about Payroll Change Management. The welcome screen of the tool provides a step-by-step guide.
User Interface
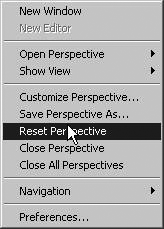
Navigation in the GUI uses perspectives, groups of view panes designed for tasks such as understanding and comparing payroll configurations, debugging, and diagnostics. You can use the context menu to select the Reset Perspective option and return to the default screen setup (Figure 2). It reduces the effort to recreate the panes if you lose them in the middle of the tasks.

Figure 2
Choose Reset Perspective to return to the default screen settings
As shown in Figure 1, the top four panes provide a navigation guide. Entries in the Countries pane represent dated, individual payroll configurations. The tool supports multiple snapshots of the same configuration. The second pane (configuration) displays the categories of configuration objects for the selected payroll configuration. The third pane (list) records entries of the selected categories. The fourth pane (attribute) displays attributes of the selected entry in the third pane.
Depending on the object you select in the third pane, a series of object-specific panes displays various panes of the object, such as the object, outline, document, and properties panes. Figure 1 displays the wage type D100 during a comparison. Payroll Change Management shows all the key attributes for D100, including its title, documentation, valuations, characteristics, and symbolic account mappings, along with their respective delimitations. The tool cross-references many wage-type-related tables for D100 to generate this view.
Compare Configurations
Rather than guessing what’s causing a payroll glitch, you can use the tool to track discrepancies among instances. You can compare changes over time for the same configuration by viewing a snapshot of the payroll configuration at one time, and then take another snapshot at a later time, presumably after some changes. Then, use Payroll Change Management to compare them.
Without the tool, configuration changes for the same payroll overwrite previous settings. Table comparisons, like SAP’s cross-client table compare function (transaction SCMP), work only on different payroll configurations. You have to specify tables to compare individually, so to compare the entire payroll configuration, you have to remember all the tables to compare. All the changes appear as differences between strings and numbers, so you have to figure out what those mean on a table-by-table basis. Payroll Change Management compares all the tables and displays the differences by showing discrepancies with their corresponding configuration meaning rather than just numbers.
To compare two configurations, set up a base project. Each payroll configuration constitutes a project. Set up your base project in the Countries pane, right-click on your desired project, and choose Set as main project. The > sign appears before the configuration you selected to indicate it is the base configuration (e.g., >USA.rvc.800.20051208 in Figure 1).
The tool performs all comparisons at the payroll level rather than at the database-table level. Most tools (such as SAP’s cross-client table compare function) compare at the individual-table level. Users have to convert these into payroll terms by looking up the meaning of the string or numeric values in SAP HR documentation system to understand the differences.
After you set the base configuration, select a different project in the Countries pane to compare the two configurations automatically. To disable this comparison, clear the main project that you selected. The tool compares all configuration objects, including wage types, schemas, rules, processing class definitions, evaluation class definitions, wage type permissibility of infotypes, constants, and symbolic accounts.
The configuration pane summarizes differences for the entire configuration under the title bar. The list pane summarizes differences for the selected configuration category. In the Figure 1 example, 325 payroll objects exist in USA.c46.001.20051208, 1073 payroll objects exist in USA.rvc.800.20051208, and 591 objects differ between the two configurations.
The +, -, and delta icons on the right side of Figure 3 under Wage Type allow you to list additions, deletions, and changes, respectively. Selecting an entry in the list pane displays the configuration object with the changes marked in its associated object pane. Our example summarizes differences of wage type D100 between the two configurations. Select a summary entry in the wage type list pane to show the details of changes.

Figure 3
Middle screen shows all references to processing class 6.
Assess the Impact of Changes
To assess the impact of a change to a particular payroll object, you first need to locate all the objects that reference it. To find all the references to an object, select that object in the navigation, outline, or editor pane. Then, click on the References tab shown at the bottom of Figure 3. This tab displays all objects, including schemas, rules, and wage types. To prevent the system from calculating references repeatedly, click on the pinning icon  on the References tab.
In Figure 4, processing class 6 was changed from 1 (take wage type from previous payroll) to 0 (do not transfer wage type). To find all references to processing class 6, select it and click on the reference pane.

Figure 4
Assess how processing class 6 impacts rule X006
To assess how the change from 1 to 0 affects any of the objects, click on that object to display related information. Figure 4 shows how rule X006 handles processing class 6 and its values. The rule tree shows processing class 6 in the outline pane on the left. Scroll over any of the operations to display the operation’s documentation. In our example, X006 handles processing class 6 properly since the corresponding decision branches process all values. Each branch of the rule displays all the cross references next to each other.
Report Errors and Verify Configuration
The tool reports many often-neglected errors during routine configuration. By isolating these errors at configuration time rather than waiting for them to show up at runtime, payroll runs become much more predictable. Some examples of tricky errors to spot are incorrect symbolic account configurations and calling country-specific rules in rules designated for all countries.
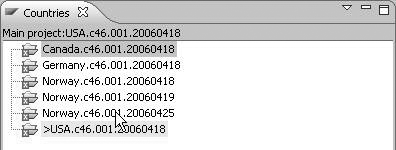
You can spot individual configuration errors easily because they jump to the top of the navigation tree. Follow the error sign down to individual payroll objects to inspect the errors. Figure 5 shows that when the tool spots errors for a configuration, it attaches the error sign (a red square with a white X) to the configuration. Follow the navigation of the configuration to drill down to the individual errors.

Figure 5
A list of payroll configurations with errors
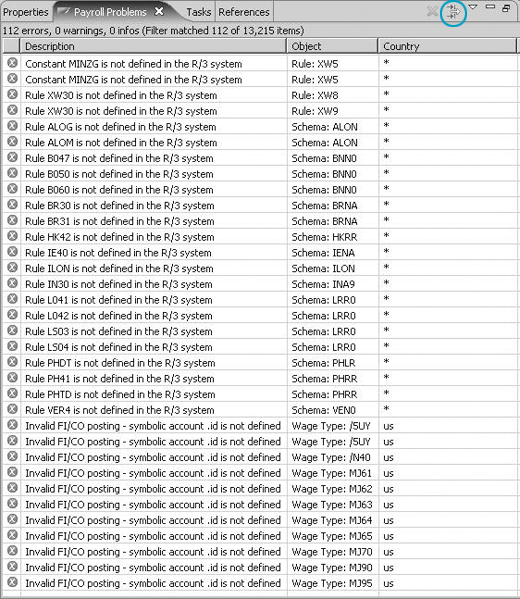
The Payroll Problems pane in the payroll perspective provides a summary view of errors and their locations (Figure 6). You can create customized filters to show a list of errors of interest. Click on the filter icon  to set the filter. The tool’s default problem view display shows errors on the selected nodes/subnodes.

Figure 6
Summary view of configuration problems
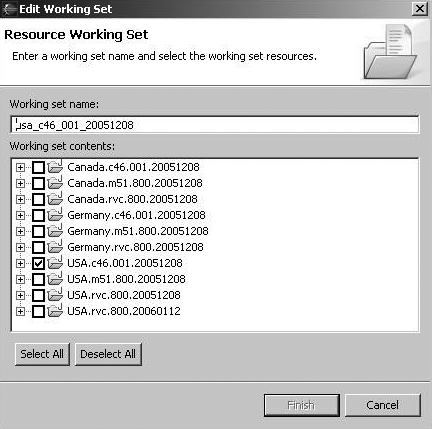
To use the working set to limit your scope of error and warning reporting, select the problems pane, open the filter wizard, and click on the filter icon. Select the On working set: (your desired configuration) button and click on the Select… button to open the working set creation wizard (Figure 7). Create working sets by following menu path New>Resource>(your desired configuration). Select the category of errors to list (Figure 8). After you select the working set, the tool reports errors for the configuration.

Figure 7
Automatically display errors using a filter

Figure 8
Define working set
Alternatively, you can display project errors automatically by default. Select the On selected resource and its children button (Figure 7). If you change the selection, then the reported problems differ. For instance, when you navigate to the wage types of the configuration, the problems view reports the errors for wage types only.
You can customize the filter in the problems pane to check for specific problems. Although defaults provide context-sensitive reporting, this requires more CPU resources since the system checks for errors any time the selection changes. However, other settings do not report errors dynamically.
Identify Errors with Payroll Log
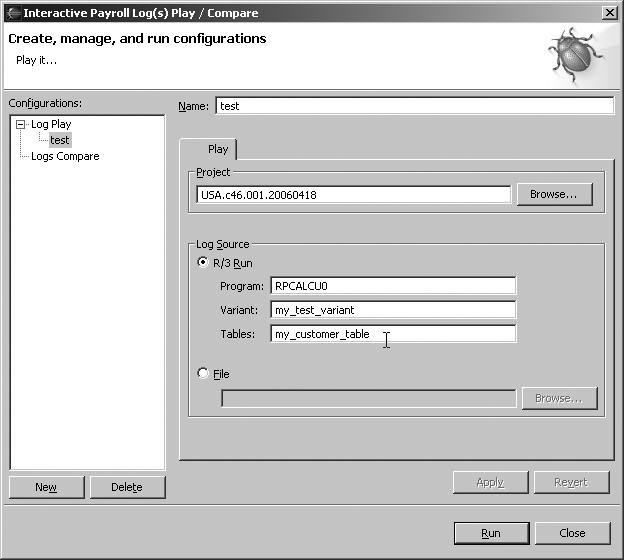
The tool provides an enhanced payroll log with detailed information. The tool archives and extracts a log to inspect it with identical payroll configuration. The log identifies payroll calculation errors and any master data errors that affect payroll results. The tool can inspect both global variables that the payroll driver accesses and header rows of tables within rules to check for calculation process. Figure 9 shows how the tool logs standard information about program RPCALCU0 and a customized table and variant.

Figure 9
Payroll log
When replaying a log, the tool switches to the corresponding perspective. A perspective is a group of panes for a particular task. For example, the payroll configuration perspective groups all the relevant panes for checking the configuration objects, and the debug perspective groups all the relevant panes for debugging.
The console pane presents log information along with the list of periods. To the left of Figure 10 under Log Explorer, the console controls log inspection including stepping, termination, and period selection. Click on any payroll period on the console pane to set the context to display the log for a certain period and the associated tables.

Figure 10
Interactive log replay
The Log Explorer pane presents the entire run for the period in a tree format (Figure 10). The source pane on the right titled U010 displays the source code of a current schema or rule that corresponds to the selected node in the Log Explorer pane. The screen highlights the point of execution of the payroll run for any selected node.
The table list pane (to the left of Table Data) presents the list of tables available in the log. Double-click on the tables to inspect. Alternatively, type the leading characters and then press Enter. When a node references data, the pane highlights the names of the tables or other data. Click on the Only show referenced tables button to display just the highlighted tables.
The Table Data pane displays before and after states of the selected table and differences in the selected node in Log Explorer. A color legend at the bottom of Figure 10 explains the table states.
To start the log replay, select the desired period and tables, and then click on either the Stepping into or Stepping over icons  . The stepping into icon follows the trace one level down and the stepping over icon follows the trace log to the next step of the same level. Otherwise, click on any node in Log Explorer. The screen displays the status of the log run for the payroll run up to that node, including tables and the source code (schema, rules, or operations). To see the list of tables any node uses, right-click on that node in the Log Explorer view. Click on the table to add it to the Table Data view.
The log comparison feature can assess the impact of configuration changes to payroll results. You can capture a log before applying changes, capture another log after applying changes, and then compare them.
You can compare logs for different periods from the same or different logs. You can compare run logic and data differences. The two ways to compare them are called report style and interactive.
To use report style comparison, click on the Log compare button or use menu path Window>Show view>Other…. Then, select Payroll Log Diff. Click on the two Open log file… buttons to select the log files to compare.
The screen displays all the differences in run logic (Figure 11). Click on any of the nodes to display data for that node and their differences. To see the nodes with data differences, click on the delta icon in the lower right side of the screen.

Figure 11
Report style log comparison.
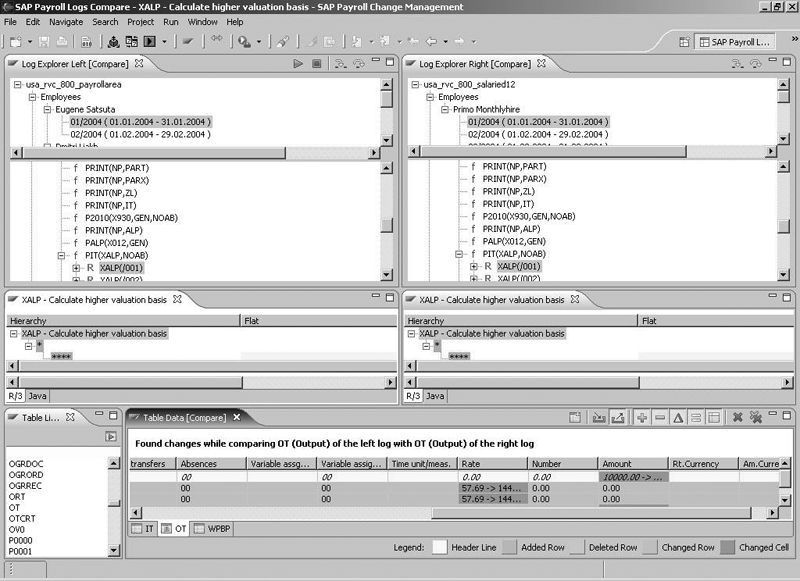
Interactive log comparison provides more flexibility when comparing logs. Select the periods and the tables to compare, and then use the stepping icons to navigate. You can move both logs forward in the Log Explorer view and in the source code view at the same time. In Figure 12, the first row represents the consoles, the second row shows the logs for selected period, and the third row displays the source codes. The Table Data view at the bottom of the screen displays data differences. To view the nodes with differences, click on the play icon.

Figure 12
Interactive log comparison.
Wage Type Explorer Tracks Payroll Results Errors
Payroll results errors are often very challenging to track. These results do not surface during payroll run, but frustrated users report them. They can relate to basic pay, vacation accruals, or deductions for benefits. They occur when payroll calculates the corresponding wage types incorrectly.
Wage Type Explorer tracks the payroll run process by individual wage types, examining how the system processes, creates, changes, stores, and displays wage types. You can inspect all functions, rules, and operations. Furthermore, you can isolate critical information by showing only the changes. To use Wage Type Explorer, go to the main Payroll Change Management screen and click on the Wage Type Explorer button or use menu path Windows>Show view>Other…>Select Wage Type Explorer.
Click on the File button to open up a log file, and then select the period to check. Click on the op button on the top right side of Figure 13 to show operations. Click on the delta icon to show changes only.

Figure 13
Wage Type Explorer isolates critical information by displaying changes only
Igor Tsyganskiy
Igor Tsyganskiy runs SAP’s Advanced Technology Group and reports directly to Shai Agassi. The purpose of the group is to create software to improve user productivity and significantly reduce the cost of ownership for existing SAP software.
You may contact the author at i.tsyganskiy@sap.com.
If you have comments about this article or publication, or would like to submit an article idea, please contact the editor.
Jack Cai
Jack Cai is the director of product management for Payroll Change Management at SAP Labs. He has 15 years of experience in software industries.
You may contact the author at jack.cai@sap.com.
If you have comments about this article or publication, or would like to submit an article idea, please contact the editor.
