Learn how to create reports in the new SAP Advanced Planning and Optimization (SAP APO) demand planning add-in for Microsoft Excel from scratch. Follow a use case to help you understand the prerequisites for using this functionality.
Key Concept
The SAP Advanced Planning and Optimization (SAP APO) demand planning add-in for Microsoft Excel provides a method for casual users to view and adjust SAP APO demand planning data. This software is delivered through a Service Pack (see the Administrator’s Guide at https://service.sap.com/~sapidb/012002523100005812682015E for details).
No matter how advanced your statistical forecasting is, inherent market and customer volatility means that it’s still necessary to improve your forecast by incorporating key intelligence on customer demand and market behavior. Leading demand-planning processes start with a statistical baseline forecast and enrich it with input from the sales, marketing, and supply chain functions before reaching a consensus on future demand.
The most common method for capturing input from sales and marketing relies on an exchange of spreadsheets. Although it is possible for users in sales and marketing to enter forecasts into SAP Advanced Planning and Optimization (SAP APO), casual sales and marketing users often don’t perform this task regularly enough to become familiar with SAP APO planning books. They prefer a method enabling them to capture forecast changes offline while they are on sales calls.
SAP released the SAP APO demand planning add-in for Microsoft Excel in mid-2014. I walk you through the steps needed to enable this functionality in your SAP APO system and provide advice on report design. You then can create the Excel reports that casual users in sales or marketing can use to enter forecast adjustments.
Setting Up Connections
Assume that your Basis team has installed the add-in software by applying the Service Pack in your SAP APO system and that you have installed the add-in software on your computer. Refer to the Administrator’s guide above for details on these steps if needed.
The first step is to create a connection. Connections define the parameters needed to connect to an SAP APO system. They are conceptually equivalent to the entries in the SAP Logon Pad and contain the following information:
- Network information about the SAP APO server (host name and port)
- The planning book and data view to be used
- The planning version to be used
The planning book, data view, and planning version are based on the configuration design implemented, so they are already known. You can determine the host name and port by performing the following steps. You may need your Basis team to help if you don’t have access to the Service Internet Communication Framework (transaction code SICF).
Execute transaction code SICF in the SAP APO system to which you want to connect. In the main menu at the top of the screen select Goto > Port Information. The Port Information screen appears (Figure 1). You need the information under the Service and Host Name headers. Depending on your security approach, you should use either the HTTP (not secure) or HTTPS (secure) protocol.

Figure 1
View the port information
You only need to do this once for each SAP APO system you use. After you have the host name and port information, you can create a connection for the add-in. First, open Microsoft Excel, select Demand Planning on the Excel ribbon, and click the Log On button. This action displays the Logon dialog box with the Connection field (Figure 2). Because you haven’t created a connection yet, the Connection field is empty.
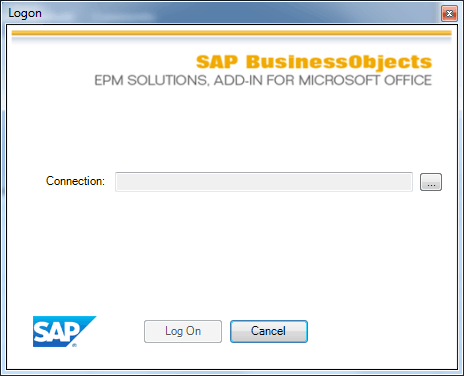
Figure 2
The Logon screen
Click the ellipsis icon to the right of the Connection field. This action opens the Connection Manager screen (Figure 3). Click the Create… button.

Figure 3
The Connection Manager screen
In the Create Connection screen (Figure 4), enter a name in the Connection Name field. It’s a good idea to include a reference to the SAP APO server in the connection name. Although the Connection Manager shows you the host name of the server for each connection, you may find those hard to remember, so including Development or Production in the name makes it easier to select the correct connection.
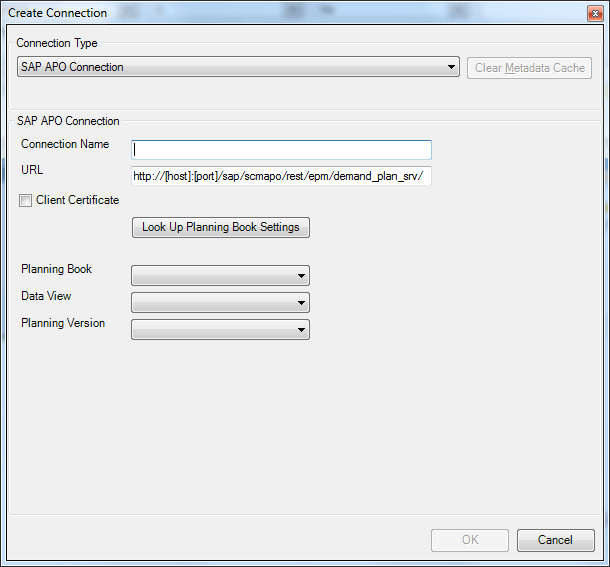
Figure 4
The Create Connection screen
In the URL field, replace [host] with the host name from the Port Information screen, and [port] with the value from the Service field in the Port Information screen. Be sure to delete the square brackets also. Your finished URL field should look like this:
https://myAPOserver:8000/sap/scmapo/rest/epm/demand_plan_srv/
If you are using the secure HTTPS protocol, check the Client Certificate check box to show the Certificates… button. Click this button to select a security certificate to be used to authenticate you in single sign-on environments.
Click the Look Up Planning Book Settings button (you may need to log in with your user name and password if you are not in a single sign-on environment). This action populates the three drop-down fields for Planning Book, Data View, and Planning Version.
Select the Planning Book, Data View, and Planning Version you prefer to use from the three drop-down options. Note that the contents of these lists are filtered based on your authorization in the SAO APO system.
Click the OK button to return to the Connection Manager screen. Right now you have only one connection, but it’s still useful to set this as a default connection. Doing so means that it is automatically selected every time you click the Log On button in the Excel add-in ribbon. To set this connection as a default, click the Set as Default button as shown in Figure 5.
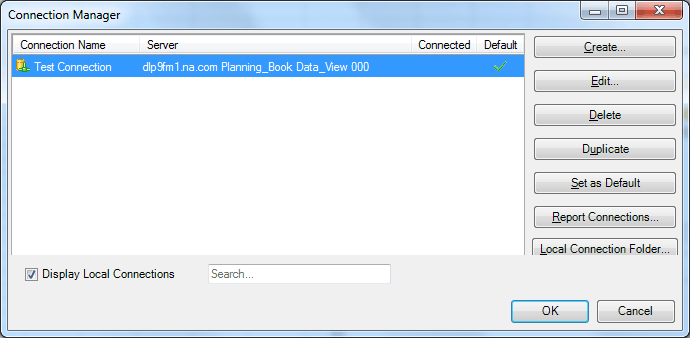
Figure 5
The Connection Manager screen with a new connection
Click the OK button and log in to your SAP APO system.
Steps to Create a New Report
Now that you are logged into the SAP APO system, you can create a new report. Reports are the Excel spreadsheets that are used to display and change data from SAP APO. Similar to designing a planning book, you need to make some choices about which types of data to display and how to structure it
Report Definitions
Key design choices for each template include:
- The planning level for the template. As with SAP APO demand planning, the planning level is a combination of characteristics or navigational attributes. Examples are Product, Brand, Customer, and Region.
- The key figures to be shown. Examples are Sales History, Statistical Forecast, and Sales Forecast.
- The horizons (number of historical and future months to display)
These factors can vary between different groups of users. Sales may be interested in a three-month forecast by customer and product, whereas marketing may want to see a full year at the Brand and Region levels. Each of these different combinations of planning levels, key figures, and horizons means a separate report. An important point to note is that the choice of planning book and data view that you set in the connection acts as a filter when creating a report. For example:
- The report can only contain key figures that exist in the selected data view
- The maximum horizons for the key figures can’t exceed the maximum horizons in the data view. You can, of course, choose to show a smaller horizon in the report. However, it’s important to note that if you need a rolling horizon (i.e., the start and end months shift so that you always see the same number of historical and future months), then you need to include the full horizons from the data view. You can hide excess columns in Excel if the user doesn’t need to see them. You could also create additional data views in SAP APO Demand Planning with different horizons.
Setting Default Options
Before you create the report for the Sales group, it’s helpful to set some default options. These options are applied for each new report you create, so it saves time to do them now.
Create a new blank workbook in Microsoft Excel. Switch to the Demand Planning ribbon and select Sheet Options… from the Options menu button as shown in Figure 6.

Figure 6
Launch the EPM – Sheet Options screen
In the EPM – Sheet Options dialog, ensure that the Use as Input Form check box is selected as shown in Figure 7, so that you can use the report to enter data.
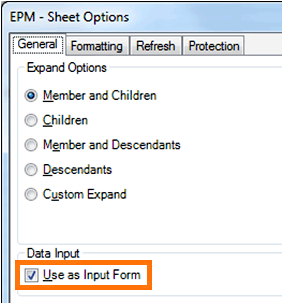
Figure 7
The EPM – Sheet Options General tab
Click the Formatting tab. Ensure that Apply Dynamic Formatting check box is selected as shown in Figure 8 so that you can specify formatting rules for specific content in the report later.

Figure 8
The EPM – Sheet Options Formatting tab
Click the OK button (not shown) to set the options.
Creating the Report
For my example, for the report you build, take the Sales use case. Your report will contain:
- Planning level: Ship to Customer and Material (Product)
- Key Figures: Statistical Forecast and Sales Adjusted Forecast. It will be useful for the salesperson to refer to the Statistical Forecast as a benchmark when entering a forecast into the Sales Adjusted Forecast key figure.
- Horizons: Because you are not including shipment history in this example, you show four months of data, starting from the next month (April 2015).
As you follow the steps below, you notice that the actual values available to you are based on your own SAP APO system, which may have a different configuration (different key figures, characteristics, time periods). Substitute values from your own system.
To create the report, in the Demand Planning ribbon, click the New Report button as shown in Figure 9.
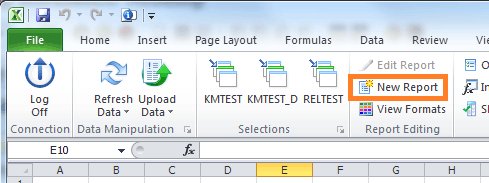
Figure 9
Create a new report
The EPM – Report Editor screen appears (Figure 10) with the Layout tab selected.
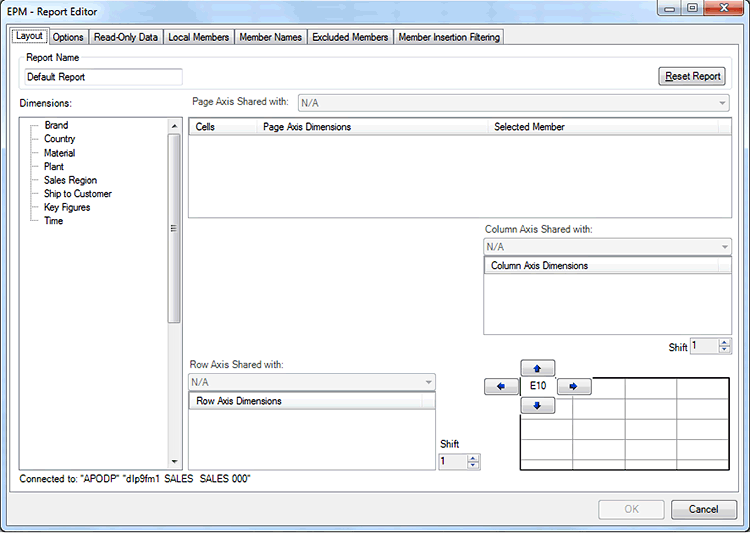
Figure 10
The EPM – Report Editor screen
Drag the Time node from the Dimensions list on the left to the Column Axis Dimensions box. This means that each month shows in sequential columns in your report.
Drag the Material and Ship to Customer nodes from the Dimensions list on the left to the Row Axis Dimensions box at the bottom of the screen.
Drag the Key Figures node from the Dimensions list on the left to the Row Axis Dimensions box at the bottom of the screen.
At this stage, the screen should look like the one shown in Figure 11.
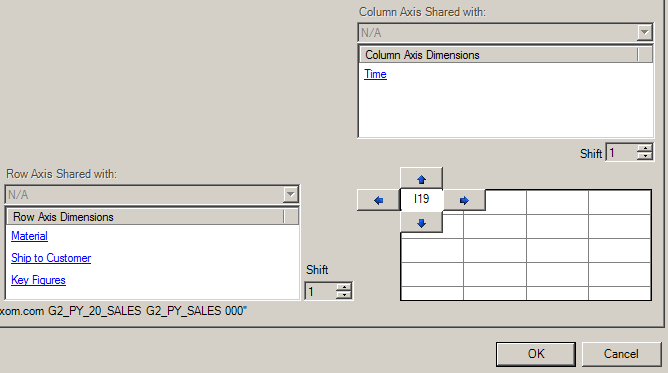
Figure 11
Report axes defined
The report now has enough definition to execute, but there are some further steps you need to take to make this report meet your requirements.
Each time a dimension is added to the page, row, or column axis, the tool automatically applies a default filter to that dimension. You now remove or adjust those defaults to make the report match your design.
Click the Time link in the Column Axis Dimensions box. You see the EPM – Member Selector – Time screen as shown in Figure 12. The exact list of time periods listed on the left (Dimension Members) is based on the configuration of your data view. The tool has automatically applied a filter of February 2014 (02 2014) in the Selected Members list, and prefixed it with the text Context. The design in my example calls for the report to show the next four months, so remove February 2014 and replace it with April 2015 through July 2015.
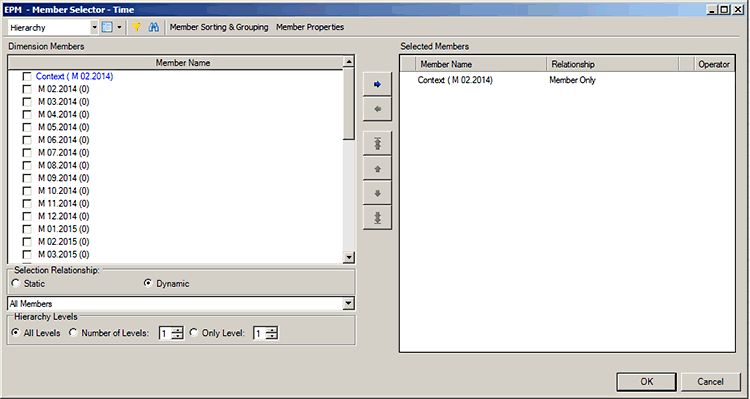
Figure 12
The EPM – Member Selector – Time screen
Click the Context (M 02.2014) entry in the Selected Members list on the right. This action enables the left-facing arrow button, which removes an entry from the Selected Members list. Click this button to remove the entry.
Because you want to show the periods April 2015 (04 2015) through July 2015 (07 2015), click both of these entries in the Dimension Members list on the left (you may need to scroll down to see them) and click the right-facing arrow to add them to the Selected Members list.
The screen now looks like the one shown in Figure 13. Notice that you needed to specify only the start and end periods. Click the OK button (not shown).

Figure 13
Start and end periods specified
Click each of the remaining dimensions (Material, Ship to Customer, and Key Figures) and for each one remove the Context entry and replace them with different values.
Another method you can use instead is to remove all the filters from a dimension. Ensure that none of the entries are selected in the Dimension Members list and click the right-facing arrow. This action adds an entry All Members to the Selected Members list as shown in Figure 14.

Figure 14
Select All Members
The definition of the basic report is now complete. Back in the EPM – Report Editor screen (not shown), click the OK button to execute the report. You should see something similar to the report shown in Figure 15.

Figure 15
The completed simple report
This report may not look very fancy, but it is already fully functional. With this report you can:
- View data from the SAP APO system
- Change the data in the spreadsheet and upload the changes directly to SAP APO
- Add Excel comments and save them back to SAP APO as cell notes
This article contains general information only and Deloitte is not, by means of its publication, rendering accounting, business, financial, investment, legal, tax, or other professional advice or services. This article is not a substitute for such professional advice or services, nor should it be used as a basis for any decision or action that may affect your business. Before making any decision or taking any action that may affect your business, you should consult a qualified professional advisor.
Deloitte shall not be responsible for any loss sustained by any person who relies on this article.
As used in this document, "Deloitte" means Deloitte Consulting LLP, a subsidiary of Deloitte LLP. Please see www.deloitte.com/us/about for a detailed description of the legal structure of Deloitte LLP and its subsidiaries. Certain services may not be available to attest clients under the rules and regulations of public accounting.
Copyright © 2015 Deloitte Development LLC. All rights reserved.
Alistair Thornton
Alistair Thornton is a specialist leader at Deloitte Consulting. Alistair specializes in Demand Planning, Supply Planning, and Sales and Operations Planning. He’s been working in this area for more than 15 years, helping some of the world’s largest companies to improve their supply chain planning capability. Alistair’s experience spans the consumer products, food and beverage, life sciences, high-tech, and chemicals industries.
You may contact the author at alithornton@deloitte.com.
If you have comments about this article or publication, or would like to submit an article idea, please contact the editor.


