SAP NetWeaver provides functionality to detect and analyze potential application and system problems. However, sometimes you need more information than what the standard SAP NetWeaver system provides, such as internal application information. Find out how you can use SAP NetWeaver Application Server Java and SAP NetWeaver Development Studio to delve deeper into the debugging process.
Key Concept
SAP Microsoft Management Console (SAP MMC) is based on Microsoft Management Console and is only available for Microsoft Windows-based systems. You can use this tool to administer any number of SAP NetWeaver Application Server (SAP NetWeaver AS) Java engines running on any operating system such as Windows and Unix. SAP MMC can manage all these JEE engines, thereby providing a single tool for administering your entire SAP NetWeaver AS Java environment.
As a developer, application expert, or system administrator of business applications, you may need to analyze the application execution and check its internal state to guarantee its proper functionality. This is especially important during the development and test phases of your custom business applications. However, the reality is that even well-designed, well-managed applications, such as Java-based applications, may experience some type of problem sooner or later. You are the first line of defense and often the first person to become aware of the situation.
From a high-level perspective, you use the SAP monitoring functionality to get an overview of the application’s state. If you determine that problems exist, you use the SAP logging and tracing functionality to check the existing logs and traces for more information. Regardless of the reason, your immediate task is to identify the source of the problem as quickly and efficiently as possible so you can fix it.
However, many problems can only be identified through debugging. In this situation, you need to connect with your SAP NetWeaver Development Studio to run SAP NetWeaver Application Server (SAP NetWeaver AS) Java. You can configure the SAP JEE engine as a single-instance JEE engine or as a more complex JEE engine, which is a JEE cluster consisting of many JEE instances installed on different physical servers.
The JEE cluster may consist of many physical servers that run JEE instances. Each JEE instance may consist of many JEE server nodes. You use the SAP Web Dispatcher to send user requests to a particular JEE server node. In my example of activating the debugging functionality, the JEE server node requires a special handling notation in the user request to access the particular JEE server node. The SAP dispatcher has to dispatch the request to the JEE server node on which the debugging is active.
Debug Configuration in SAP NetWeaver AS Java
When the SAP monitoring or logging and tracing functionality does not provide enough clues to help you isolate the cause of an application problem, use the Java debugging functionality. This option is best for custom applications because it enables you to dive deeper into your SAP NetWeaver AS Java applications.
Note
The SAP NetWeaver AS Java can run on Java Virtual Machine (JVM) from different providers, such as SAP JVM, IBM JVM, or the standard JVM from Sun Microsystems. The standard SAP NetWeaver AS Java uses SAP JVM.
SAP NetWeaver AS Java Config Tool allows you to turn the debugging SAP JEE Engine functionality on and off. Start the Config Tool by using its startup script (configtool.bat on Windows systems or configtool.sh on Unix systems). This script is located on the central J2EE instance in the configtool directory:
- On Windows systems: <drive>usrsap<SID>JC<InstNo>j2eeconfigtool
- On Unix systems: /usr/sap/<SID>/JC<InstNo>/j2ee/configtool
Figure 1 shows the general configuration of the SAP JEE server instance in which you can configure the number of JEE server nodes in a particular instance and enable the debugging functionality by clicking the Enable Debug Node check box.
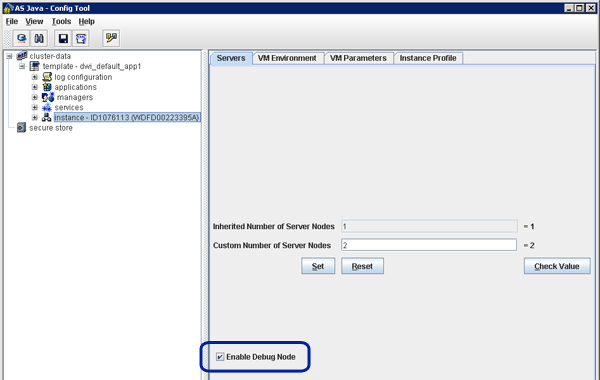
Figure 1
SAP JEE server general configuration in the Config Tool
Figure 2 presents the VM Environment view, which contains the configuration of the following debugging-relevant parameters:
- Debuggable: The parameter that indicates that the SAP JEE server instance is eligible for debugging (can be switched to debug mode). When the JEE server instance is eligible for debugging (the value of the Debuggable parameter is true), you can use SAP Microsoft Management Console (SAP MMC) to activate the Java debugging functionality. Selecting the Enable Debug Mode check box in Figure 1 changes the Debuggable parameter to true in Figure 2.
- DebugMode: The parameter that indicates that specific JEE server nodes of the JEE server instance are running automatically in debug mode
- DebugPort: Parameter that defines the port number used for debugging SAP JVM. This parameter starts with 5 and is calculated using the JEE server instance number — ${INSTANCE_NUMBER} — and JEE server node number — ${NODE_INDEX}. This means the string that provides the port number is built from the following substrings — constant 5 and JEE server instance number ${INSTANCE_NUMBER} and 26 + ${NODE_INDEX}. For example, the debug port for JEE server instance number 10 and its first JEE server node is 51026.
Note
The standard SAP JEE server configuration indicates that the JEE server node is eligible for debugging. The JEE server instance number and JEE server node number specify the debug port.
Tip!
If you are running SAP NetWeaver AS Java on a Unix-based system, you must first install SAP MMC on a separate Windows-based system (the system where you install SAP MMC does not need to be running SAP NetWeaver). The SAP MMC installer is located on the SAP Support Portal at
https://service.sap.com. For more information about Microsoft Management Console, see the document “
Step-by-Step Guide to Microsoft Management Console.”
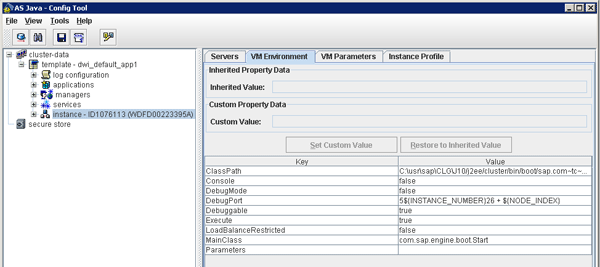
Figure 2
VM Environment tab in the Config Tool
The next new functionality is SAP MMC, which is available via the SAP NetWeaver AS Java entrance page (Figure 3). Start SAP MMC as an administrator (or a user with administrative rights) directly from the Web browser using the URL https://<server_ID>:<port>/index.html in which the < server_ID> is the name or IP of the physical server where the SAP NetWeaver AS Java is running (e.g., wdfd00223395a) and the < port> is the http port number (e.g., 51000). In my example, the URL is: https://wdfd00223395a:51000/index.html. This allows you to start SAP MMC in any machine running on a Windows operating system.
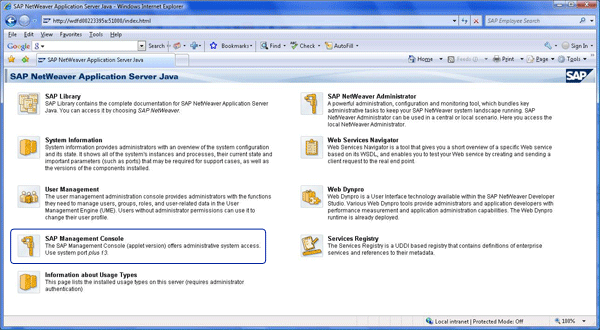
Figure 3
SAP NetWeaver AS Java entrance page
Figure 4 shows SAP MMC with an exemplary SAP JEE server CLG (the system SID). To enable debugging in particular SAP JEE server node, use the navigation pane (left window in SAP MMC) and navigate to the process overview. Follow Java AS > Process Table of the particular JEE server instance (SAP Systems > <SID> > <Instance> on <server_ID> [e.g., SAP Systems > CLG > J10 on wdfd00223395a]). SAP MMC shows you the list of processes on the right pane. To activate debugging, select the particular JEE server node (e.g., server0), right-click, and select Enable Debug from the context menu.
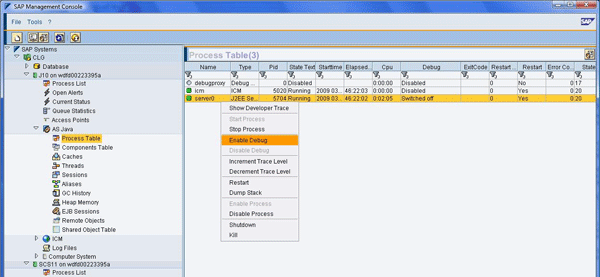
Figure 4
Enabling debugging in SAP MMC
Note
The first time you call SAP MMC, the application asks you for a user who is authenticated to perform the enabling and disabling actions. Make sure to use a user that is authenticated to manage the SAP JEE server, such as a user with local administrative rights on the physical server where the SAP JEE server instance is running.
After you enable debugging, click the refresh icon to update the debug status, which you can view in the Debug column in Figure 4. If you successfully enabled debugging, the status in the Debug column changes to Switched on (Figure 5). You can also see the active debug port (51026 in my example). If you could not enable debugging, SAP MMC provides an error message, such as when the user is not authorized for this particular action.
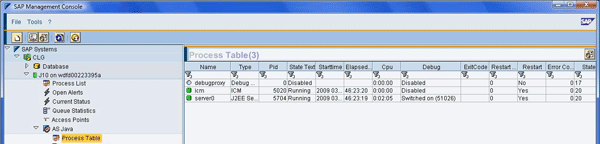
Figure 5
SAP JEE server nodes with activated debugging
Remember to turn debugging off for the JEE server node when you are finished debugging. In the new version of SAP NetWeaver AS Java (7.01 or later), you do not need to restart the JEE server instance or disable the debuggable functionality.
Configure Debugging Connection in SAP NetWeaver Developer Studio
You can debug Java applications using SAP NetWeaver Developer Studio, which is a software development platform based on the Eclipse Integrated Development Environment (IDE), which supports development of Java-based applications. SAP NetWeaver Developer Studio also allows you to connect to local or remote Java applications, such as an SAP JEE server running in debug mode.
You can also activate the debugging in SAP NetWeaver Developer Studio using the SAP Management console view (an Eclipse plug-in that is similar to SAP MMC). In SAP NetWeaver Developer Studio, go to Window > Show View > Other. In the Show View selection screen select SAP AG > SAP Management Console (Figure 6).
Figure 6
Open SAP management console view in SAP NetWeaver Developer Studio
To add an SAP JEE server, right-click SAP Systems and select the New SAP system entry. The Add new SAP System pop-up dialog opens (Figure 7). Specify the host name where the SAP JEE server instance is running and the instance number. You can also optionally select the domain name (system grouping) and use the secure HTTP protocol.
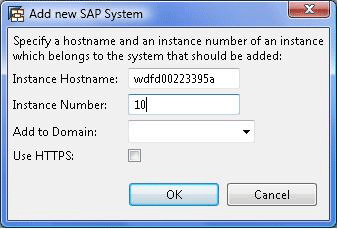
Figure 7
Add a new SAP JEE system
After you enter the SAP system data and click the OK button, the system is added to the list of SAP Systems. Now you can view the CLG system, including the process table that contains the list of JEE server nodes, its state, and the debug state (Figure 8). Select the JEE server node, right-click, and select Start Debug Session. In the pop-up dialog, choose one of the following debugging options (Figure 9):
- Suspend: This option suspends all running threads. This means that this particular JEE server node does not process any other user requests.
- Code Isolation: You can debug all JEE applications that run on application threads without JEE services by using system threads. The SAP JEE engine uses the application threads to perform end-user requests and system threads to perform internal tasks that the JEE services provide. To ensure system consistency, this option requires a restart of the JEE server node.
- Load Isolation: Allows you to use load balancing functionality to forward the debugging request (user call with debug session ID) to a particular JEE server node
- Session Migration: All existing user sessions are moved to other running JEE server nodes
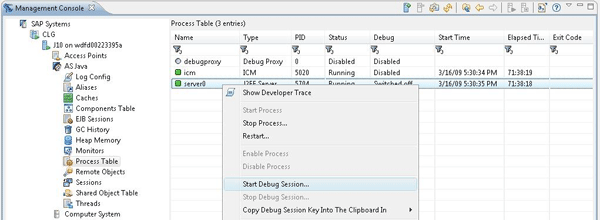
Figure 8
Start the debug session for the selected JEE server node
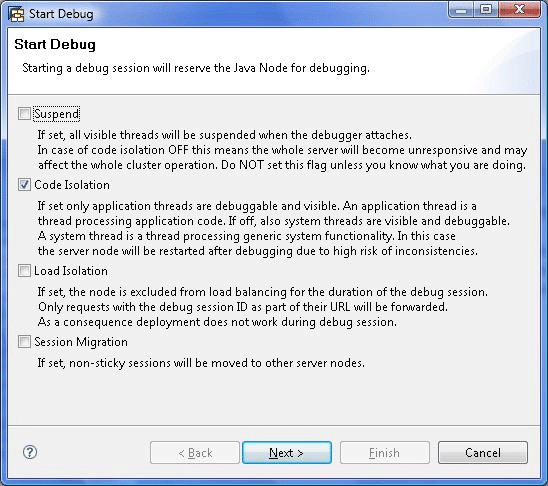
Figure 9
Select the debug session option
In my example, I need to debug a business application without affecting other SAP JEE server nodes or other processes. For this, I selected the Code Isolation option in Figure 9. This option requires restart of the JEE server node, so it may take a few moments.
After activation, click the circled refresh icon to actualize the debugging status in Process Table in SAP Management Console (Figure 10). As you can see, the debugging status changes and shows the user that is already connected to the JEE server node — in my example this is user d029324 connected from server WDFN00184663A (the name of the server where SAP NetWeaver Developer Studio is running).
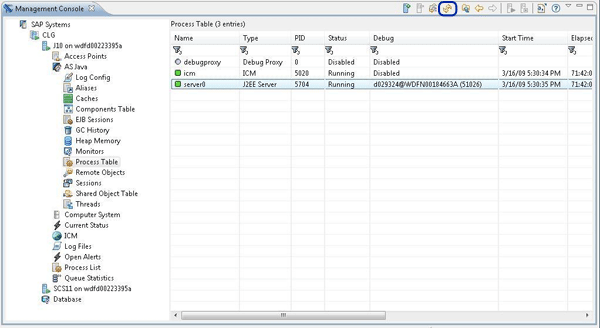
Figure 10
Debugging status with the connected user
Now you can open the debugging perspective in SAP NetWeaver Developer Studio by going to Window > Open Perspective > Debug (Figure 11). This allows you to debug your Java application running on the SAP JEE server node. In the default configuration, the debug perspective contains the following:
- List of threads (Debug tab)
- List of set breakpoints (Breakpoints tab)
- List of Java variables (Variables tab)
- Opened Java sources (Service.java tab)
- List of variables and methods of selected Java class (Outline tab)
- Console output (Console tab, which is not active in a remote connection to JEE server node)
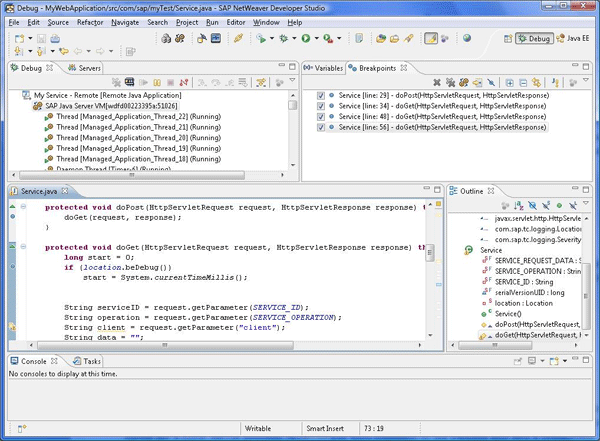
Figure 11
Debugging perspective in SAP NetWeaver Developer Studio
If the performance of the connection to your SAP JEE server is low (i.e., on a slow network), you should configure the debugger timeout parameter so that the debugging session does not terminate. Follow menu path Window > Preferences > Java > Debug and modify (i.e., increase) the value of the parameter Debugger timeout (ms) as shown in Figure 12. Additionally, the network problems can prevent the initial connection to JEE server node. In such a case you need to modify (i.e., increase) the value of the Launch timeout (ms) parameters.
Note
Before you modify the value of the Launch timeout (ms) parameter, check to see if you have properly configured the debugging parameters for and that no other debugger is connected to the debugging port. (The JVM debugging allows only one connection to the debugging session at a time.)
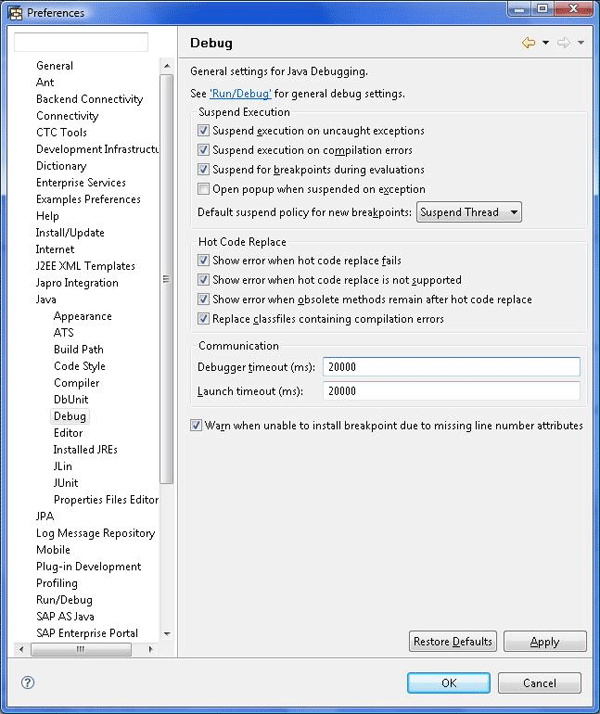
Figure 12
Configuration of debugging parameters in SAP NetWeaver Developer Studio
Debugging Business Application Running on SAP NetWeaver AS Java
The next important question is how to call the Java application on a particular JEE server node from the Web browser. SAP NetWeaver AS supports the following URL extension, which directs the SAP dispatcher to send the request from the Web browser to the JEE server node:
@@@DEBUG@@@<cluster_ID>
<cluster_ID> is the ID of the JEE server node that is running in debug mode. The above extension is used in SAP JEE server versions higher than 6.20 and lower than 7.10.
The extension
@@@DEBUG@@@[key=xxx]
is valid for SAP JEE server versions 7.10 and higher. The [key=xxx] is the generated connection key (Figure 13).
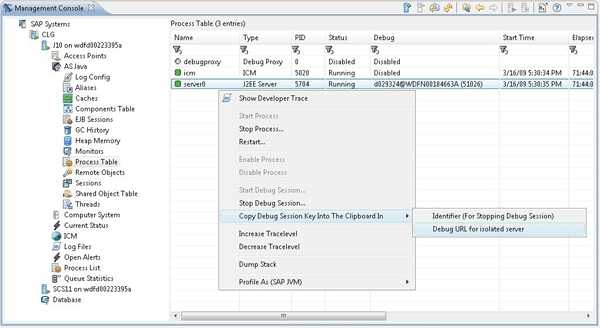
Figure 13
Obtain the debug URL in SAP Management Console in SAP NetWeaver Developer Studio
Figure 13 shows you how to obtain the debug URL in SAP Management Console in SAP NetWeaver Developer Studio. Select the J2EE server node, right-click, and select Copy Debug Session Key Into The Clipboard In > Debug URL for isolated server.
For example, for an SAP JEE server 7.0, the debug URL has following syntax:
https://<server_id>:<port>/@@@DEBUG@@@<cluster_ID>
- <server_id> is the name or IP of the physical server where the SAP NetWeaver AS Java is running (e.g., wdfd00223395a)
- <port> is the http port number (e.g., 51000)
- <cluster_ID> is the ID of the JEE server node running in debug mode
For example, to call an initial page of the JEE server node, the SAP Management Console generates the following URL:
https://wdfd00223395a:51000/@@@DEBUG@@@-3564675/
Note
As I mentioned previously, debugging can affect the functioning of the designated JEE process and could potentially interfere with the entire JEE server cluster. Therefore, before you launch the debugging session on a particular SAP JEE server node, activate proper debugging options to prevent unexpected side effects.

Robert Heidasch
Robert is the chief innovation and technology lead in the global Accenture Technology Platform, which is responsible for SAP Leonardo and the new digital technology defining business value and driving the digital transformation of complex enterprise solution for Accenture diamond and strategic clients. Before that he was responsible as innovation and solution lead for the design and architecture of new business applications developed jointly by Accenture and SAP based on the newest SAP and non-SAP technology. Robert is the Accenture certified Senior Digital Architect and Senior Technology Architect. He is coauthor and trainer of a couple of SAP technology-related trainings for the in-memory platform and architecture of new business applications (e.g., SAP HANA, SAP Cloud Platform, and SAP Leonardo applications for solution architects and technical architects, all of which were provided by Accenture in Europe, the US, and Asia). Robert has more than 23 years’ experience designing and developing IT systems. He published several technical and business articles about SOA, SAP NetWeaver and its integration with non-SAP systems (e.g. Microsoft, Oracle, etc.), and SAP HANA technology. He is also an inventor of 38 patents in the US in the area of in-memory technology, artificial intelligence and machine learning, security, semantics, and SOA. He is a frequent speaker in international business conferences and SAP Forum. He is a subject matter expert in customer projects worldwide and has extended experience in team leadership in Europe, the US, and India.
You may contact the author at robert_heidasch@outlook.com.
If you have comments about this article or publication, or would like to submit an article idea, please contact the editor.