Manager
Learn how to perform effective Java memory analysis on your system using a Solution Manager Diagnostics component that many users don’t take advantage of. Find out how you can tell if your Java applications are performing at their best, and discover a variety of ways to analyze system performance.
Key Concept
Solution Manager Diagnostics is part of SAP Solution Manager 7.0. It offers functions to analyze and monitor an SAP NetWeaver system landscape — and Java functions in particular. The main features of Solution Manager Diagnostics are the tools, such as end-to-end workload analysis, which provides information about the Java memory analysis. This is invaluable when you are trying to diagnose what is happening in your system if your Java application fails to respond, is slow, or crashes.
Mention the words Java and memory analysis and most SAP administrators shudder in fear. The whole idea of doing any sort of performance tuning on the Java stack remains a mystery to most SAP consultants and administrators.
However, for an SAP NetWeaver-based system using Java functions, Solution Manager Diagnostics provides useful tools for this kind of system analysis. For example, it provides the ability to carry out quick and efficient end-to-end Root Cause Analysis, which can isolate a component that might be causing an issue in your system landscape. You can also use end-to-end workload analysis to help diagnose a general performance problem with your Java system and, more specifically, the Java memory analysis tool to determine if there is a performance problem with your Java applications.
Java memory analysis is an important tool that provides you with invaluable insights into what is happening in the memory of a Java Virtual Machine (JVM), which I’ll explain in more detail in the next section. Although it is one of the most overlooked components of Solution Manager Diagnostics, it is also one of the most useful. The information this tool provides in minutes can sometimes take hours, if not days, to find without Java memory analysis.
Note
SAP strongly recommends downloading and applying the latest Support Package. This ensures you are using the best and most up-to-date version of Solution Manager Diagnostics.
Note
Diagnostics agents collect the diagnostics data on the managed system and pass them to Solution Manager Diagnostics. For all newly installed systems based on SAP NetWeaver Application Server 7.0 SR3 or higher, the Diagnostics agent is automatically installed and waits until the managed setup wizard initiates a connection. For all other systems, the Diagnostics agents must be installed separately according to their installation guides.
Basics of Java Memory Analysis
Java is a programming language like any other. However, unlike traditional programming language compilers that generate machine code for a specific platform, the Java compiler produces program code for the JVM. A virtual machine is a model computer program that emulates a processor. The JVM is viewed as the interface between Java and the actual hardware.
In the SAP NetWeaver Application Server architecture, the Java instance comprises a Java dispatcher and one or more server processes. The Java dispatcher distributes the client requests that it receives from the Web browser to the available server processes of the instance. The server processes provide the infrastructure in which the Java 2 Platform, Enterprise Edition (J2EE) applications run.
The JVM is available within each process and loaded at startup time. The JVM provides the environment in which Java code is executed and it also distributes memory for the respective Java applications. It handles the memory allocation when an object is created, and then deallocates (i.e., no longer reserves) the memory when that object is no longer referenced by the application. This memory deallocation is done by a special Java agent called the garbage collector, which is part of the JVM. The garbage collector is a process that is constantly active during the runtime of a Java application and shares the same resources, such as the CPU and address space.
Why should you be interested in the garbage collector? To begin with, if it does not deallocate memory for objects that are no longer required by a Java application, you can run out of memory for your applications very quickly, as the memory that is allocated by the JVM is not deallocated and therefore cannot be used for another Java application. Also, while the garbage collector is running, all other activity on that server node comes to a standstill because the garbage collector shares the same resources as the Java application and is resource-intensive. Therefore, you need to ensure that your garbage collector is performing efficiently. To understand how the garbage collection takes place, you first need to understand how memory is used within a JVM.
Java Memory Management
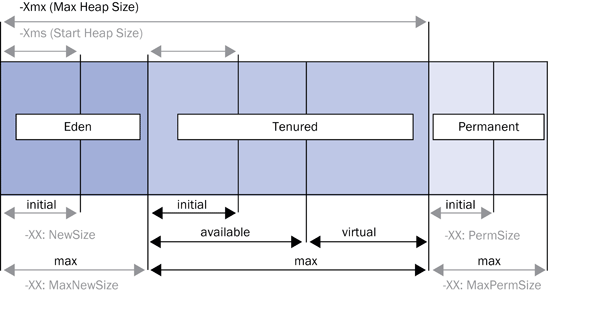
The memory is divided into three main areas, called generations: the Eden (young) generation, the tenured (old) generation, and the permanent generation (Figure 1). You use a Java administration tool called the Config Tool to configure the memory in the JVM.

Figure 1
Simplified representation of the memory areas in a JVM and their respective configurable parameters (shown as XX)
A generation reserves a certain amount of operating system memory for the JVM. Each generation has an initial size in which an initial amount of memory is allocated (indicated by the generation’s initial size parameter). Once this initial memory has been used, the JVM allocates further operating system memory in stages up to the maximum amount (indicated by the generation’s maximum size parameter). You cannot directly define the initial and maximum sizes of the old generation because they are calculated from the parameters for the young generation and the parameters: -Xms and -Xmx. The parameter -Xmx is the maximum heap size and defines the total size of the young and old generations. The parameter -Xms is the start heap size and defines the total initial size of the young and old generations.
Note
The generations seen in my example are used in the Sun, HP and IBM J9 Java Virtual Machine. SAP recommends setting the start heap size (-Xms) to the same value as the max heap size (-Xmx). This ensures that all the memory the JVM should be able to use is allocated from the start of the process. It also prevents later system activity from increasing and decreasing the size of the allocated memory.
The three generations differ based on the data that is stored in them. Any object that is newly created by a Java application is stored in the young generation. When the young generation becomes full, the garbage collector process is triggered and a minor garbage collection is performed. The minor garbage collection checks all the objects in the young generation. If an object is no longer being referenced by any application, it removes that object from the memory of the young generation. Objects that are still required by an application are automatically moved to the old generation. Any freed space is also compressed.
When the old generation becomes full, the garbage collector process is triggered again. However, this time a full garbage collection is performed between the young and the old generations. The full garbage collection checks all the objects in the young generation, and if the object is no longer referenced by an application, it removes that object from memory. Objects that are still required by an application are automatically moved to the old generation. The full garbage collection then checks the objects in the old generation, and if an object is no longer being referenced by an application, it removes the object from the memory of the old generation. If the object is still being referenced, the object remains in the old generation. Lastly, the garbage collection compresses the freed space.
The permanent generation is reserved for the system libraries and classes. These should always be in the memory because they are permanently required by a JVM. Java class libraries provide the programmer with a well-known set of functions to perform common tasks, such as maintaining lists of items or performing complex string parsing. In addition, Java class libraries provide an abstract interface for tasks that would normally depend heavily on the hardware and operating system, such as network access and file access.
Because the garbage collection process shares the same resources as the Java application, all other activity on that server node comes to a standstill while a garbage collection process is running. The recommended size for the young generation is normally one-fifth of the old generation. As such, the minor garbage collection runs more frequently (several times a day) and for a shorter duration (usually around 0.1 or 0.2 seconds). On the other hand, the full garbage collection runs less frequently (as it takes longer to fill up the old generation) and the process takes a bit longer (ideally, less than 10 seconds).
Typically, companies start to experience performance issues when the memory areas are filling up too quickly or when full garbage collections are running frequently throughout the day. The users on that server process experience a system standstill situation or, if there is a problem with an application (such as a memory leak), the application could terminate with an out-of-memory error.
Therefore, to diagnose a performance issue that might be related to the Java memory, it is first important to find out what is happening with the garbage collections. This gives you an indication of whether there is an overall problem with the memory in the server process or if there is a problem with a particular Java application.
Solution Manager Diagnostics: Java Memory Analysis
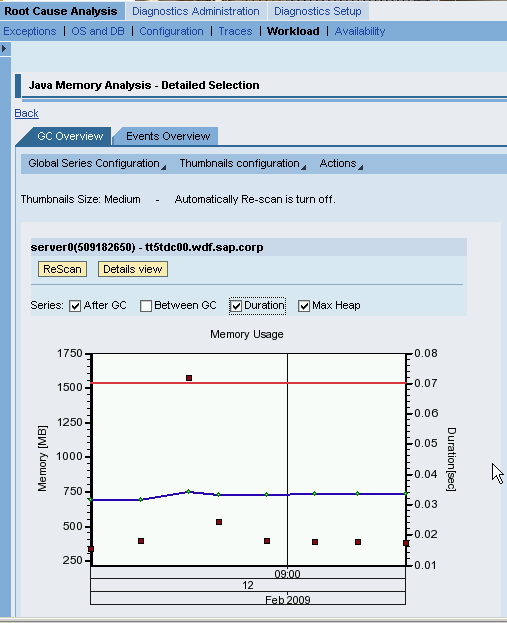
Through Java memory analysis, Solution Manager Diagnostics enables you to see how efficiently your garbage collector is performing. Follow menu path Root Cause Analysis > Workload > Java memory analysis and select the GC Overview tab (Figure 2).

Figure 2
Java Memory Analysis garbage collection overview
Java memory analysis provides the details on the efficiency of the garbage collection for the server node of a particular instance during a selected time frame. On a system with good performance, the Java memory analysis diagram typically looks like the screen shown in Figure 2. The red line indicates the max heap memory that is available to a particular server process. The blue line indicates the amount of max heap memory that is currently in use. The square dots indicate the garbage collections that have taken place, with their position on the chart based on their duration.
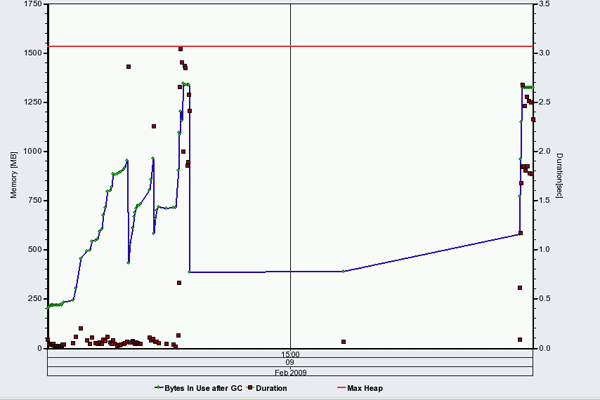
In contrast to the well-performing system in Figure 2, the example in Figure 3 shows a system with memory issues. There is a problem with the Java memory and the system is busy with multiple garbage collections. You can see that the amount of heap memory that is allocated increases up to a point, but there is a sudden drop after a number of garbage collections. This typically occurs when an application crashes with an out-of-memory error. These details will be caught in the trace file for the server process (i.e., std_server0.out).

Figure 3
Garbage collection overview with an out-of-memory error
From the Java memory analysis, click the Details view button to see statistics about the system’s garbage collection behavior (Figure 4). The garbage collection statistics give you an indication of whether the Java memory is an overall problem for the server process, if the garbage collection is the reason for the poor performance, or if a particular application might be causing the problem. What the statistics do not provide are the details of who or what application is consuming the memory, or what caused the out of memory error.

Figure 4
Details view
The garbage collection statistics are an important starting point for Java memory analysis. They also provide useful key performance indicators (KPIs) for garbage collections, such as the average garbage collection times and the garbage collection time versus the total elapsed time. You can also see if the memory allocation is increasing (even after a full garbage collection), if garbage collections are running too long, and if there is an appropriate percentage of full versus minor garbage collections. This is useful because the number of full garbage collections should ideally be less than 5% of the total number of garbage collections. For example, in the 30-minute time frame shown in Figure 4, you can see that there were 87 garbage collections. Less than 5% of these should be full garbage collections, so there should have been approximately four full garbage collections. However, you can see that there were 24 full garbage collections during this time, which is an indication of problem.
Based on these initial evaluations, it may be necessary to do further analysis after answering these questions:
- Is there truly a memory-related problem? How efficient is your garbage collector?
The total garbage collection time per time interval should be small (less than 5%). This means that if your system has been running for an hour, less than 5% of that time is the maximum amount that should be spent on garbage collections. Also, investigate the average duration of specific garbage collections. The multiple minor garbage collections should only take 0.1-0.2 seconds and run more frequently. The full garbage collections take a little longer (i.e., less than 10 seconds) but are far less frequent (again, they should only comprise 5% of all garbage collections during a particular time interval). Some minor and full garbage collections might take a bit longer than the times listed here, but as long as the total amount of time for all garbage collections is less than 5% of the total time interval, there should not be a significant performance impact on the system.
- Is there a general memory problem or an application-specific memory problem?
If the heap size has not been optimally configured, then the garbage collections either run more frequently because there is not enough memory, or, when they do run, it is for a long time because the memory areas in the JVM are too big. However, if the problem is related to a particular application, Java memory analysis indicates that out-of-memory crashes occur whenever the application is run. In this scenario, it is necessary to do further analysis on the particular application using SAP Memory Analyzer, which provides a quantitative memory analysis (i.e., what amount of memory is occupied by certain areas or which class is leaking) and a qualitative memory analysis (i.e., how much memory is allocated by a single request, what the typical content of a user session is, why a certain class is leaking).
- Can your system handle the expected load increase and peaks in terms of increased memory use and higher garbage collection overhead? If there is a performance issue related to the Java memory currently in your system, then chances are your system cannot cope with any increased memory use over a period of time. If you are expecting an increased number of users or applications in the near future, then you should check the recommended sizes for the generations provided in SAP Note 723909.
The information displayed in Java memory analysis is taken from the standard output file that is scanned on a regular basis by the Diagnostics agent. The garbage collection behavior information is also transferred to the Introscope Enterprise Manager (part of CA Wily Introscope). You can view this information through dashboards in the Introscope WebView or the Introscope Workstation, both of which are standard pre-delivered functionalities in Solution Manager Diagnostics.
Note
CA Wily Introscope is Web application management software that allows you to detect and diagnose performance problems in your service-oriented architecture environments. It is one of the third-party tools that is fully integrated in Solution Manager Diagnostics, and it provides server-side end-to-end Root Cause Analysis. As part of the SAP Solution Manager 7.0 license, SAP provides a license for CA Wily Introscope for SAP-delivered instrumentation and dashboards. However, you have display-only access with this license, so it does not allow you to create instrumentation for custom code, create your own dashboards, or change any of the existing monitoring thresholds. You can extend the capabilities of CA Wily Introscope with SAP Extended Diagnostics by CA Wily, which was introduced in November 2008.
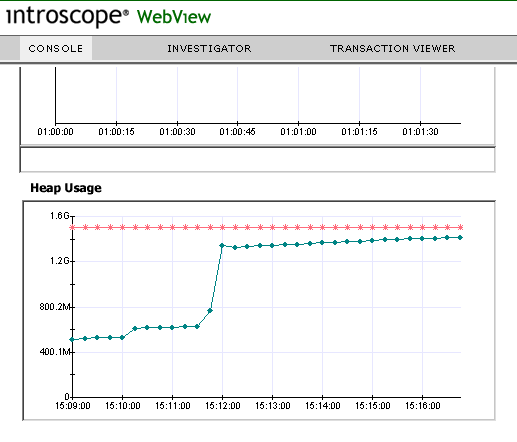
Figure 5 is a screenprint taken from the Introscope WebView console view, which provides ad-hoc analysis of what is happening with the Java heap memory at a particular moment. Figure 5 clearly shows that the Java heap memory currently in use (the teal line) is almost the same as the maximum heap memory available (the red line), which indicates that an out-of-memory error will arise shortly.

Figure 5
Introscope WebView console view of heap memory usage
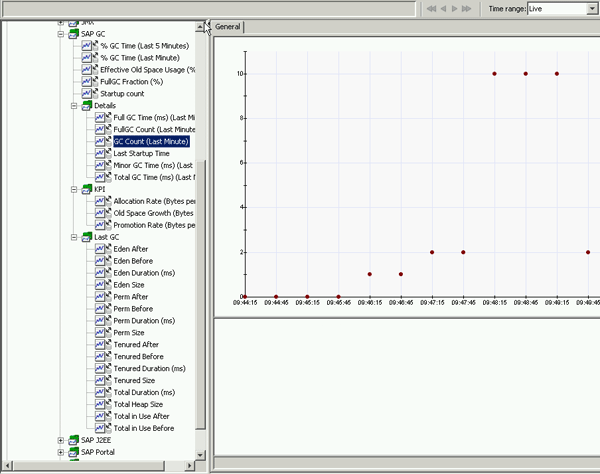
Figure 6 shows the Investigator view in Introscope WebView and all the dashboards that relate to garbage collections. You can see more detailed information about what is happening with different generations, the number of garbage collections that have taken place, and other useful KPIs. Figure 6 highlights the GC Count dashboard that shows the number of garbage collections that have taken place over a live time range (i.e., what has been happening in the system in the last minute).

Figure 6
Introscope WebView investigator view of garbage collection dashboards
Java memory analysis is an important starting point for a number of Java performance-related issues. It does not provide all the answers, but it can point you in the right direction for further analysis. This invaluable information is often overlooked, but what you can find in a matter of minutes using Java memory analysis would take you significantly longer if you simply analyzed the standard output file (std_server0.out) for the server process, where information about your garbage collections is kept.

Shanthi Sivasubramaniam
Shanthi Sivasubramaniam is an independent trainer and consultant based in the United Kingdom with more than 13 years of SAP experience. During this time, she has held positions as a technical consultant and trainer with KPMG Malaysia, Logica, and SAP UK. She has worked on numerous SAP projects in Europe and Asia and has delivered SAP training courses all over Europe, South Africa, and the Middle East, focusing specifically on SAP administration and SAP Solution Manager courses. Shanthi has been working with SAP Solution Manager from the time it was first introduced and has helped numerous customers install and configure the various functionalities available. She has a degree in information technology and business information systems and is an SAP-certified technology professional and associate for platform technology with SAP NetWeaver 7.0, a solution consultant for SAP Solution Manager 7.0 operations, E2E application management expert in Root Cause Analysis, change control management, process integration, and automation optimization, and has a number of other SAP certifications.
You may contact the author at info@sustainsystems.com.
If you have comments about this article or publication, or would like to submit an article idea, please contact the editor.
