Learn best practices for integrating SAP BusinessObjects Web Intelligence data into SAP BusinessObjects Dashboards, with a focus on how to use Web services generated in Web Intelligence Rich Client. This type of integration allows dashboards to become dynamically loaded applications rather than manually refreshed visual models.
Key Concept
BI Web services are Web-based applications that enable the exchange of data between BusinessObjects client tools. BI Web services provide the capability to pass data from Web Intelligence to BusinessObjects Dashboards by sending the cluster unique identifier of a source report block to a destination object. This information is communicated through a Query as a Web Service connection type in the BusinessObjects Dashboards Data Manager using a Web Services Description Language URL. Table data from the sourcing Web Intelligence document is then linked to the dashboard, enabling it to consume the information as output values. The biggest advantage of Web services is that they alleviate the need for manual data refreshes in dashboards.
This article was originally published on BusinessObjects Expert
The need for data discovery and data exploration is often the underlying driver behind ad-hoc reporting. With SAP BusinessObjects, users have a tool that can help them discover trends quickly and pinpoint outliers when sifting through tables containing millions of records.
For many analysts, the tool of choice for this type of analysis has been, and continues to be, SAP BusinessObjects Web Intelligence (also known as WebI). However, what if the data discovered is so powerful that every decision-maker in the organization needs to see it to believe it? And not just to believe it, but to make crucial business decisions based on the information? Should executives be asked to log on to InfoView to launch a Web Intelligence report or SAP Crystal Report? Or is there a better way to deliver the results to high ranking officials? In my opinion, the answer to this question is SAP BusinessObjects Dashboards (formerly known as Xcelsius) because of its highly customizable interface and portable delivery methods. The integration of Web Intelligence data into BusinessObjects Dashboards makes dashboards even more valuable.
Once Web Intelligence has been selected as the tool for retrieving and analyzing the data and BusinessObjects Dashboards has been selected as the tool for delivering the information, analysts are potentially faced with two dilemmas. The first dilemma centers on a skills requirement to effectively work with both Web Intelligence and dashboards. Ad-hoc report development capabilities are at the core of required competencies for data analysts, making Web Intelligence a reliable and commonly used tool. However, the capability to develop dashboards isn’t quite as common or as easily found with the same resources. To fully harness the power of a dashboard, analysts who truly understand the data must be involved in the design of the user interface in addition to the information that it delivers.
The second dilemma, and the focus of this article, is finding a way to integrate the data in Web Intelligence into a dashboard. From my experience, there are four common methods to integrate data from Web Intelligence documents into BusinessObjects Dashboards. These methods are listed below with the primary focus of this article being the first method, Web services.
- Web services (generated in Web Intelligence Rich Client)
- BusinessObjects Live Office
- Query Browser – Universe connectivity (available only in BusinessObjects Dashboards 4.0)
- Third-party products
Publishing Data as a BI Web Service
To convert a data block in Web Intelligence XI 3.1, begin by launching Web Intelligence Rich Client and opening the report containing the data block to be fed into BusinessObjects Dashboards. Next, right-click the data block and select Publish Block in the menu (Figure 1).
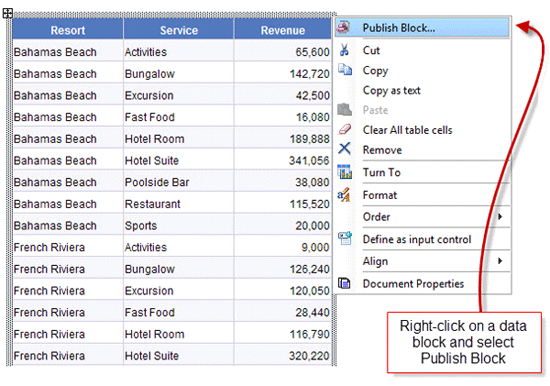
Figure 1
Publishing the content of a data block
Figure 2 shows the wizard for publishing Web Intelligence content as a Web service. Click the Next button to proceed.
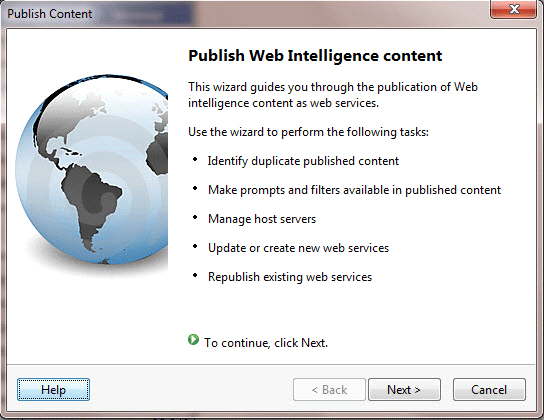
Figure 2
Guide to publication of Web content as Web services
The next screen provides the option to give a name to the report content being converted to a Web service. If the data block contains additional columns of data that could be used as a filter in the Web service, click the Set filters… button to select the content to publish. Figure 3 shows this mini-window.

Figure 3
Select filters for the content being published
Going back to the Publish Content window (Figure 2), click the Next button to select a location to save the BI Web service (Figure 4). Attach the current Web service either to a new Web service that you create, or to an existing one that you select. Click Publish once you have created or selected a Web service.
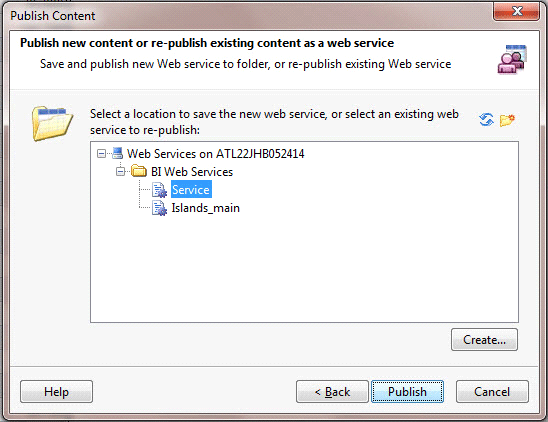
Figure 4
Select a location to save the new Web service
After you click the Publish button, a message appears to indicate that the Web service has been successfully deployed (Figure 5).
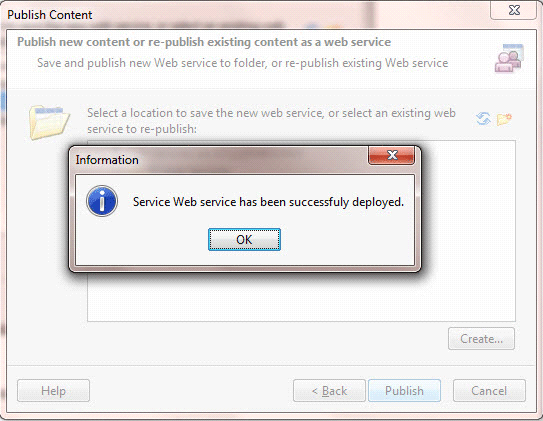
Figure 5
Confirmation message
Accessing BI Web Service WSDLs
To view the Web Services Description Languages (WSDL) of the deployed Web services, check the Show BI services box located in the upper right of the screen (Figure 6). This check box is accessible when viewing a report in Web Intelligence Rich Client.
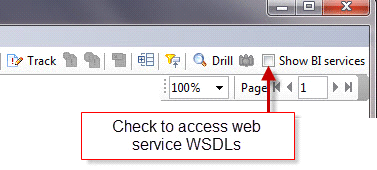
Figure 6
The Show BI services check box used for accessing Web service WSDLs
Checking the Show BI services box opens the Web Service Publisher and displays all existing Web services (Figure 7). Mouse-over a Web service to view a small pop-up of the data table used as the source for creating the service.
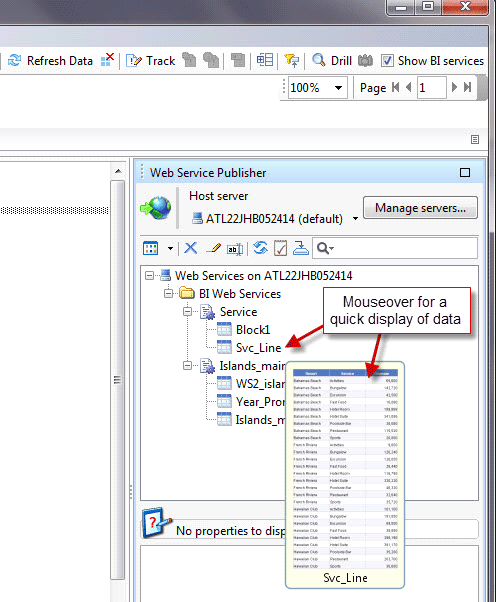
Figure 7
List of Web services
Click a report block in the Web Service Publisher window to view the properties of the object (e.g., universe name, block type, block name, block ID). Block properties are displayed in the window located immediately below the Web Service Publisher as shown in Figure 8.
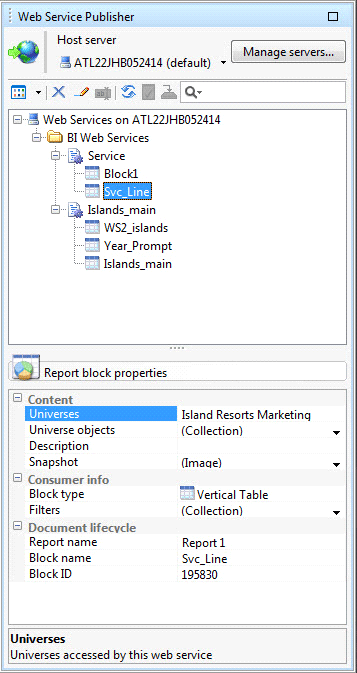
Figure 8
Web services and properties of the selected data block
By clicking a Web service rather than a data block in the Web Service Publisher, the following property values are displayed. These properties are displayed in Figure 9.
- WSDL URL
- Authentication mode
- Universes
- Identifier
The full WSDL URL is used to connect the data block values to dashboards.

Figure 9
Web service WSDL URL displayed
Consuming BI Web Services in Dashboards
To connect the Web service to a dashboard, select the full WSDL URL in the Web service properties window. You can’t right-click the WSDL URL, but you can press CTRL+C to copy the URL. Once it’s copied, launch BusinessObjects Dashboards and open the dashboard that requires the data connection.
After launching BusinessObjects Dashboards, click the Data menu and then select Connections (Figure 10). Clicking Connections launches the Data Manager and provides the opportunity to insert live data into a dashboard.
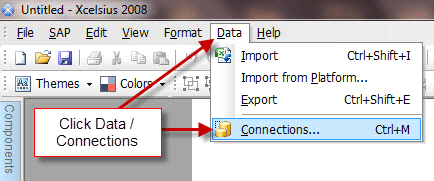
Figure 10
Opening the Data Manager in BusinessObjects Dashboards
After selecting Connections, choose Query as a Web Service (QaaWS) from the list of available connection types (Figure 11). This connection type allows the WSDL URL created in Web Intelligence Rich Client to be consumed by a dashboard.
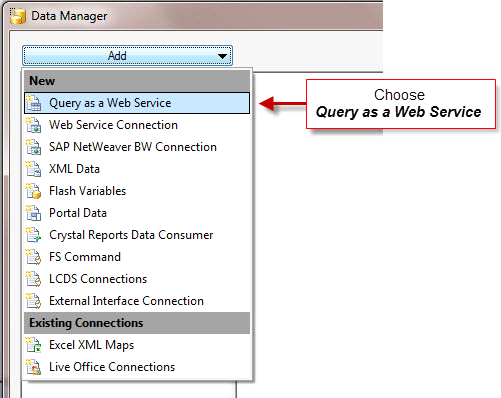
Figure 11
Choose the connection type
When the QaaWS connection type opens, paste in the WSDL URL you copied earlier and click the Import button (Figure 12).

Figure 12
Paste the WSDL URL into the QaaWS connection type in the Data Manager
You can now bind a series of input values and output values to cells in the spreadsheet. Be sure to make a selection from the Method drop-down field for the WSDL URL (Figure 13). Use the method that begins with GetReportBlock to retrieve the report block data. The method selected describes how the WSDL URL is used.

Figure 13
Select a method
To bind the data retrieved by the WSDL URL into the spreadsheet of the dashboard, select cell located under table > row. Then click the bind icon to the right of the Insert In property at the bottom of the window. This is the process to insert the data retrieved by the WSDL URL into the spreadsheet.
Tips to remember when binding to data cells in the spreadsheet:
- Always map the correct number of columns as in the Web Intelligence Rich Client document.
- Bind to a larger number of rows than expected to allow for future growth in row counts as the data increases over time. You can always ignore the blank cells in components that connect to the data.
- Be sure to color code the cells in the spreadsheet section.
Note
The data retrieved by the WSDL URL does not appear in the spreadsheet until runtime. To visualize components with data, you can use sample placeholder data in the same cells bound to the Insert In values. When the dashboard is not in development mode, the sample data is overwritten by data retrieved by the WSDL URL.
You can also bind output values for the following major result values. These are accessed by scrolling down the list of Output Values after importing a WSDL URL.
- Table headers – Located as headers/row/cell
- Table footers – Located as footers/row/cell
- user
- documentname
- lastrefreshdate
- creationdate
- creator
Using Input Values
Input values are used to pass data into the WSDL URL at runtime. If you require your users to log in to BusinessObjects to access dashboard data, do not bind the login and password input values to anything in the dashboard’s spreadsheet. However, if you’re developing an application that automatically logs in to BusinessObjects, you need a login and password that can be used for querying the Web Intelligence document that created the BI Web service.
To embed a login and password into the dashboard for seamless authentication, manually add a valid username and password to InfoView in the spreadsheet. Connect these values by selecting a password inside the Input Values box in the Data Manager (Figure 14). Click the bind icon to the right of Read From located at the bottom of the window and select the appropriate value in the spreadsheet. Repeat the same process by selecting login from Input Values.
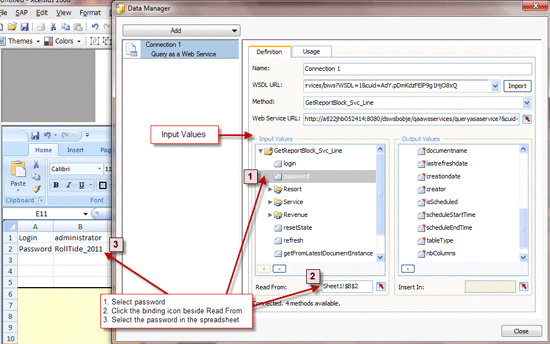
Figure 14
Binding a WSDL URL to a password hard-coded in the spreadsheet
Data Connection Usage
After you’ve configured Input and Output values in the Definition tab, use the Usage tab to review and configure the refresh options. The most common setting in the Refresh Options section on the Usage tab is Refresh Before Components Are Loaded. This keeps empty components from appearing before the data has been retrieved.
Another valuable refresh option is Refresh on Trigger, which is useful when the contents of a cell trigger a WSDL URL to refresh. With this refresh option, choose from one of the following trigger options.
- When Value Changes
- When Value Becomes
The When Value Changes option is often used when a dynamic value triggers the WSDL URL to refresh. The When Value Becomes option is used to refresh a WSDL URL when a specified cell meets pre-defined criteria.
Load Status
If your WSDLs are taking longer than two seconds to refresh, it’s a good practice to check the setting Enable Load Cursor. This setting creates less confusion to users because an hourglass appears when the query is being refreshed.
It’s a good practice to check the Disable Mouse Input on Load setting on the Usage tab of the connection to block users from clicking in a dashboard before WSDL URLs have completed loading or have activated successfully.
Query Browser in BusinessObjects Dashboards 4.0
With the release of BusinessObjects Dashboards 4.0, a new toolbar called the Query Browser allows designers and developers to connect directly to a universe to retrieve data.
Also new in version 4.0 is the ability to bind values directly from a query to dashboard components. This new functionality eliminates the need to bind data to the spreadsheet first before binding to visualization components.