/HANA/Mobile - Learn how to create an application in SAP BusinessObjects Design Studio with SAP HANA as a data source. Any organization using HANA or considering a HANA implementation can use the information in this article.
Key Concept
SAP BusinessObjects Design Studio connects directly to SAP HANA, enabling HANA to act as a data source for mobile apps created in Design Studio, such as dashboards.
Imagine a food-and-beverage manufacturer wants to analyze its sales data collected through different retails sources and make management decisions based on the same data. The manufacturer deals with big data and has invested in SAP HANA to get near-real-time analysis of its sales data on a mobile app.
HANA provides the manufacturer with the necessary figures; for example, an InfoCube contains sales details of consumer goods. Dimensions to be analyzed include product category, product subcategory, product description, sales, quantity sold, and price for the goods sold for different years. The manufacturer wants to:
- Look at the current sales patterns on a near-real-time basis to decide on short-term plans
- Look at previous sales patterns to decide on the future market strategy
Let’s look at how to take the data from HANA and make it available in a mobile app that is created in SAP BusinessObjects Design Studio.
Design Studio can use HANA and SAP NetWeaver BW as data sources simultaneously, which is not possible in BEx Web Application Designer (WAD). Design Studio serves as an alternative to BEx WAD. Design Studio working on top of HANA can be near real time in nature without hindering performance.
Here is a list of the prerequisites for using a data source created in HANA:
- Design Studio installed on the developer machine (we use Design Studio 1.0 SP2 for this article)
- A HANA 32-bit Open Database Connectivity (ODBC) connecter installed on the developer machine (we use HANA 1.0.32 for this article)
- Access to at least one HANA system
- Prior knowledge of the data warehouse concept
Steps to Integrate HANA with Design Studio
Open Design Studio. Go to the toolbar and select Tools > Preferences (Figure 1).
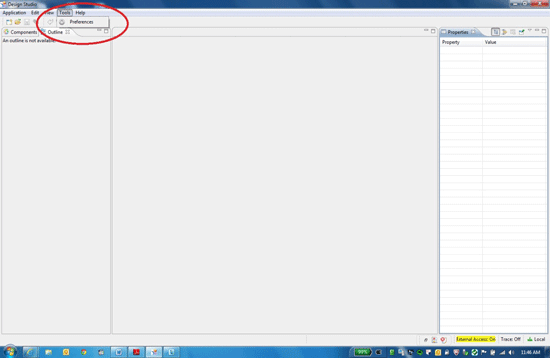
Figure 1
Select Preferences in Design Studio
(Figure 2
- Connections maintained in SAP Logon
- SAP HANA Connections maintained in ODBC Data Source Administrator
In the HANA Connections section, click the new connection icon  .
.
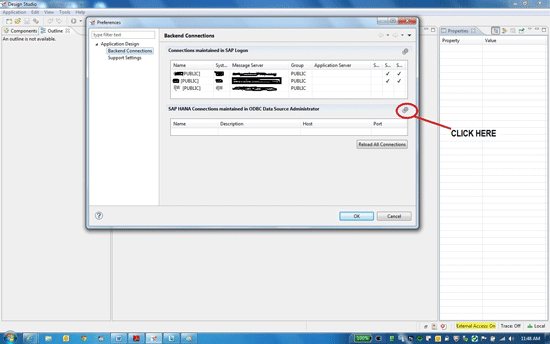
Figure 2
Click the new connection icon
In the ODBC Data Source Administrator window that opens, click the Add button to add a new connector (Figure 3).
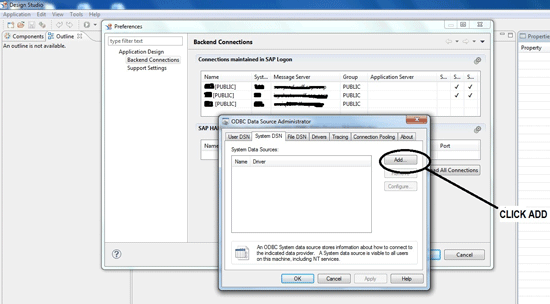
Figure 3
Add a connector
Select HANA ODBC connector HDBODBC32 (Figure 4).
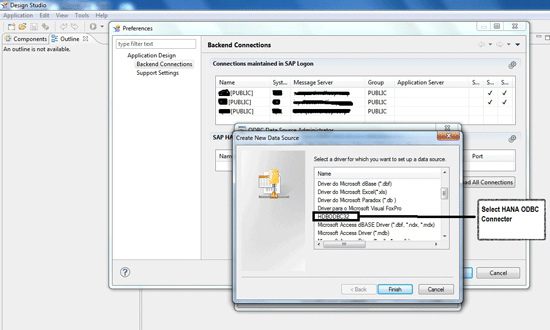
Figure 4
Select the HANA ODBC connector
In the pop-up box that appears enter the data source name and the HANA server and port. Click the Connect button (Figure 5).
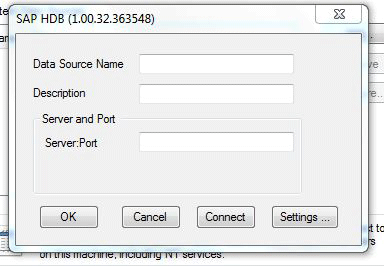
Figure 5
Fill in the details for the connector
Enter the credentials for the HANA server and click OK (Figure 6).
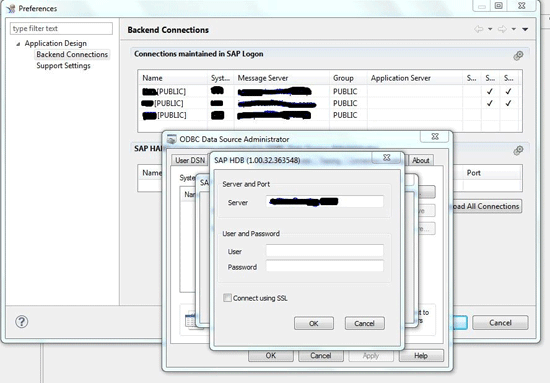
Figure 6
Enter the server credentials
If the connection is successful, you see a Connect successful! message (Figure 7); otherwise, you receive a Connection failed message.
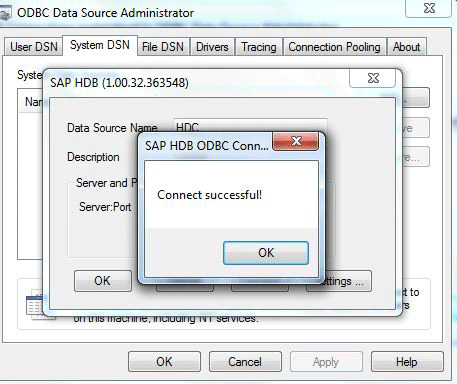
Figure 7
The system connection message
You are taken back to the Backend Connections window. Click the Reload All Connections button. You now see the new HANA connection you just added under the heading SAP HANA Connections maintained in ODBC Data Source Administrator (Figure 8).

Figure 8
View the new HANA connection
Within Design Studio, click on the new application icon  . In the Outline section of the application, right-click the Data Source folder and select New. In the window that appears (Figure 9) click the Browse button to search for the connection.
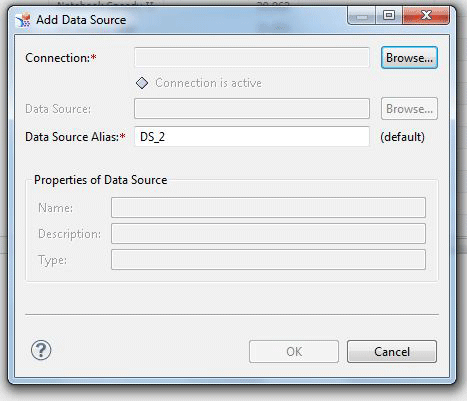
Figure 9
Browse to find the connection
Select the connection. For this example, select the HDC - HANA connection you just created and click OK (Figure 10).
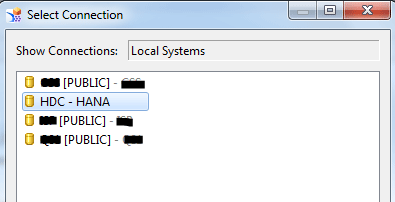
Figure 10
Select the HDC - HANA connection
In the pop-up window, enter your HANA credentials to connect to the HANA server (Figure 11).
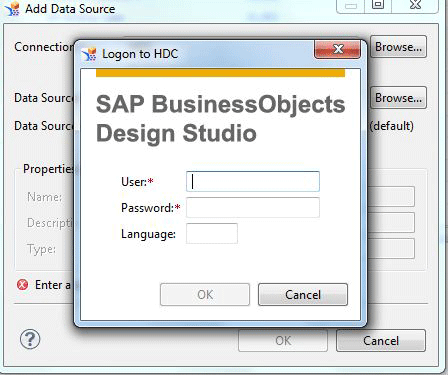
Figure 11
Enter your HANA credentials
Once you are connected to the HANA server, select the desired HANA OLAP InfoCube that was already created in HANA for reporting (Figure 12). Click OK.
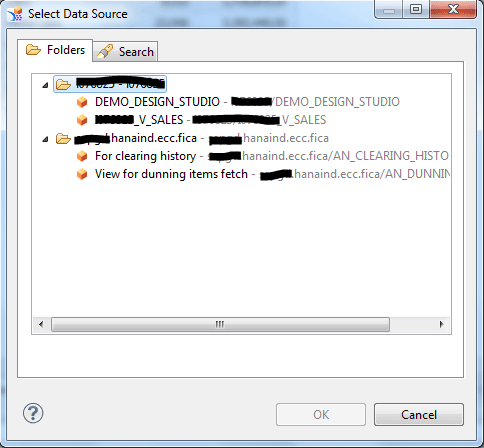
Figure 12
Select a HANA OLAP InfoCube
The new data source is now visible on the Outline section of the application. Create a crosstab to see the result of a query (Figure 13). Assign the new DS_2 to the crosstab to see the result of the data source.
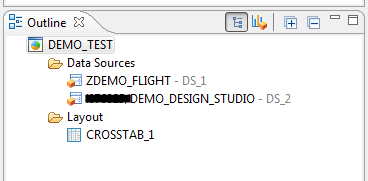
Figure 13
Create a crosstab
View the final output of the Design Studio-related app using SAP HANA. Figure 14 shows raw data in HANA.
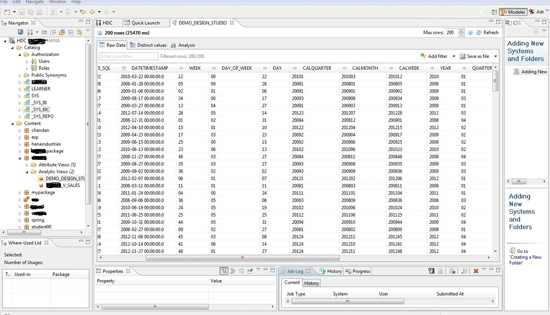
Figure 14
Raw data in HANA
Use HANA as a Data Source
Remembering our initial scenario of the food-and-beverage manufacturer that wants to track sales through HANA on a mobile app, you can now create a dashboard using HANA as a data source.
In our example, we select three analytical components (two graphs and one crosstab), one radio button component, and one text component for the dashboard (Figure 15). From the data sources available, we select DS_2 and DS_3. The crosstab and one graph use DS_2 as a data source. The other graph uses DS_3 as a data source. Radio buttons act as selectors for the years.
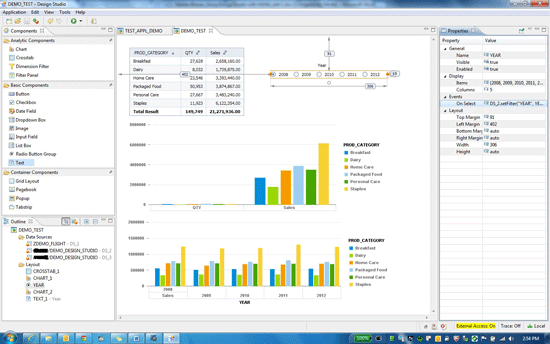
Figure 15
Create a dashboard in Design Studio using HANA as a data source
The dashboard shows sales and quantity of products in a crosstab, and it shows sales by year and quantity in different graphs (Figure 16).
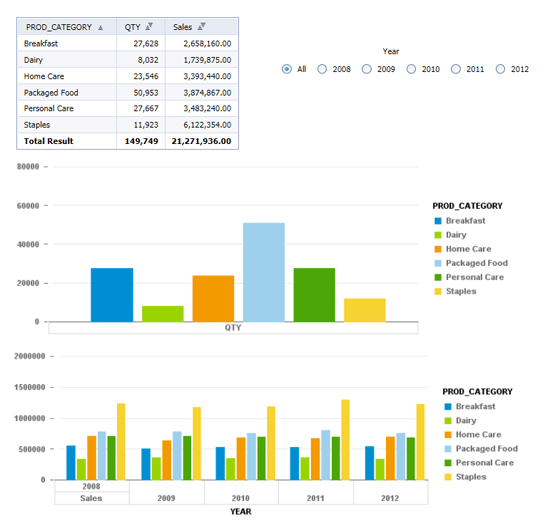
Figure 16
A dashboard using HANA as a data source
As we select a year, the data is shown accordingly to analyze it. In our example, we select 2010 so that we can review the sold quantity and the sales figures for that year (Figure 17).
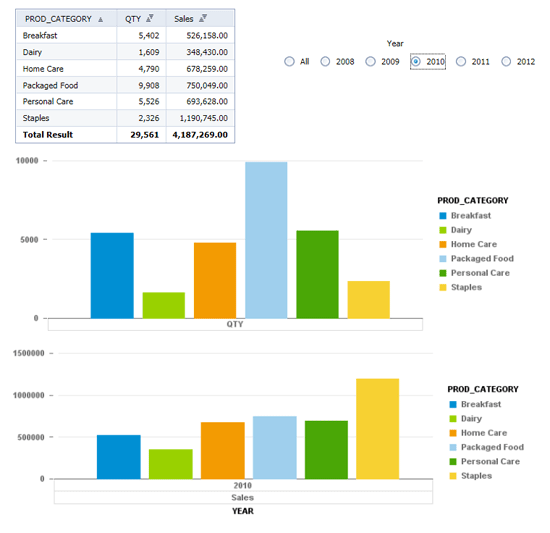
Figure 17
Dashboard results after selecting the year 2010
Biswajit Biswas
Biswajit Biswas works at SAP GD and is a subject matter expert in SAP analytics. He has five years’ experience. He is proficient in the SAP BusinessObjects suite of reporting tools and SAP Data Services. He has been associated with development of Rapid Deployment Solutions for analytics on SAP HANA, focusing on the utilities industry.
You may contact the author at biswajit.biswas@sap.com.
If you have comments about this article or publication, or would like to submit an article idea, please contact the editor.

Sunil Mehta
Sunil Mehta is a solution architect at SAP. He received his master’s degree in Computer Management from Symbiosis in Pune, India. He is a certified SAP FI/CO/BOBJ consultant, working in analytics. During his career he has been associated with Accenture, IBM, Capgemini, and KPMG, and has worked in various roles, including as a consultant solution architect and a project manager.
You may contact the author at Sunil.Mehta@sap.com.
If you have comments about this article or publication, or would like to submit an article idea, please contact the editor.