Learn how to carry out a regression test to compare payroll results before and after a major configuration change has been applied to the payroll. Detailed steps show how to create a Microsoft Excel workbook with a simple Visual Basic for Applications (VBA) program that compares two sets of payroll results and creates a new spreadsheet that highlights and identifies all the differences. The result is a simple but effective table-comparison utility with a multitude of uses.
Key Concept
Visual Basic for Applications (VBA) is a programming language that enables you to programmatically carry out many of the tasks you do manually every day in Microsoft Word, Excel, and other applications. It is created automatically behind the scenes whenever you record a macro. The language and development environment are included in most versions of Word and Excel. By becoming familiar with the VBA commands and development environment you can become a super user, and learn how to automate many repetitive and tedious spreadsheet-based tasks.
Let’s concentrate on the scenario for carrying out a full-scale regression test based on payroll results. This would be the case when there has been a major change to a stable payroll system such as an upgrade or the application of Support Packages, or a significant set of changes to a payroll schema because of new laws, contractual changes, or the addition of a new corporate entity onto the system. Normally a number of unit tests are carried out to test individual items of the new functionality. However, to increase the level of comfort you might also want to compare the payroll results at a wage type level for all the employees on the system before and after some major configuration changes have been applied. By analyzing the results, you can ensure that no unwanted changes are inadvertently introduced.
The methodology for the regression test is fairly simple. You make a copy of the production system to create a regression test client and download payroll results for a given payroll period. You apply a set of configuration changes to the regression system, rerun the payroll, and get a new set of results for the same period. Then you compare the before-and-after results. Once you analyze the differences in the two sets of results, you can be confident that these changes are safe to go to the production client.
Payroll Results Comparison Utility
The design for the comparison utility is based on the SAP View/Table Comparison transaction (transaction code SCMP) which is used to compare configuration tables across SAP system clients. This useful transaction instantly highlights any differences in configuration that may exist between systems. If you have ever struggled with systems in which transports are out of sync, then this can save you hours of manually reviewing lines, or downloading and comparing tables in Excel. In Figure 1, the wage type text table (T512T) is compared to the development master client and the development unit test client. The color-coded output clearly highlights the differences in configurations between these two systems.
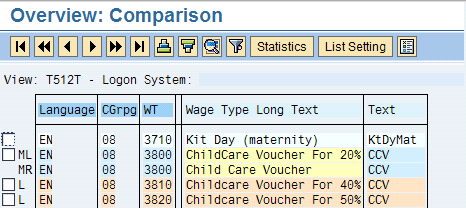
Figure 1
Table comparison on table T512T between two clients
The first line of the table (wage type 3710) is colored pale blue, meaning that there is an identical entry in both systems. The second and third lines (wage type 3800) are shown in darker blue, signifying that this table entry exists in both systems but with differences. In this example, the difference is the wage type description, and the wage type long text fields are highlighted in yellow. The fourth and fifth lines are colored pale brown and have an L on the left-hand side, meaning that this entry only exists in the logon client.
The Visual Basic for Applications (VBA) utility described below carries out a similar comparison, but by using payroll results, not configuration table entries. Returning to the payroll results regression test scenario, you can extract the original payroll results to give a before or “old” set of values. See the example results in Table 1.
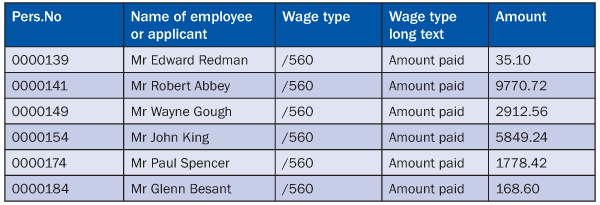
Table 1
Old version wage type reporter results before the configuration change
After the configuration changes (due to an upgrade or if Support Packages have been applied, for example), and the payroll is re-run, an after or “new” set of results can be extracted (Table 2).
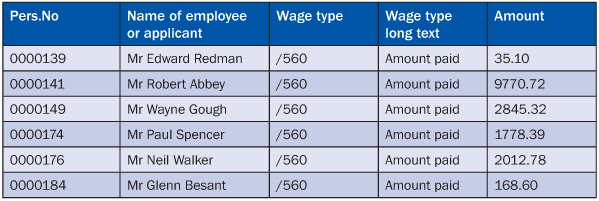
Table 2
New version wage type reporter results after configuration change
You can spot the differences when you visually compare these two tables. The third entry exists in both but the amount has changed. The fourth line exists in the old table but not in the new. Correspondingly, there are some entries in the new table that don’t exist in the old (e.g., the fifth line). While it is possible to do this comparison manually if there are a small number of entries, it would be impossible if there are thousands of lines.
The VBA utility analyzes the differences between the two spreadsheets automatically and highlights and color codes the differences (Table 3).
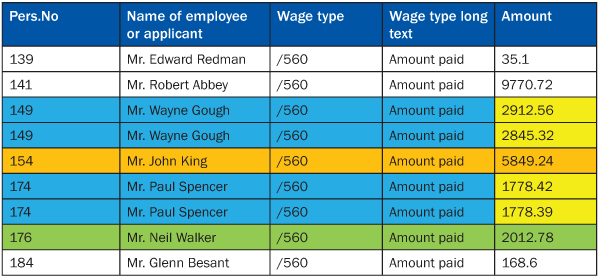
Table 3
Comparison showing the differences between the old and new spreadsheets
Table 4 shows the color-code key used by the utility. The colors approximately correspond to those used in SAP transaction SCMP to easily illustrate which entries exist in which tables, and where there are differences in field values. The color coding makes it easy to visually identify any differences.

Table 4
Comparison table key
Step-by-Step Instructions for Setting Up a Wage Type Comparison Utility
Step 1. First set up the wage type reporter. Logon to your SAP regression test environment and navigate to the wage type reporter using transaction code PC00_M99_CWTR. Complete the parameters in the selection screen for the payroll area and payroll period, as appropriate, and also enter a single wage type. In my example, I chose wage type /560 Amount paid. Click the Object selection button.
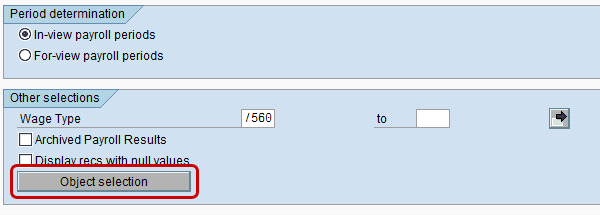
Figure 2
Object Selection button on the wage type reporter selection screen
Change the selected objects so that only the Personnel number and Wage Type objects are chosen by moving them to the Objects selected column on the right using the left and right arrows. You can change the order using the up and down arrows (Figure 3).
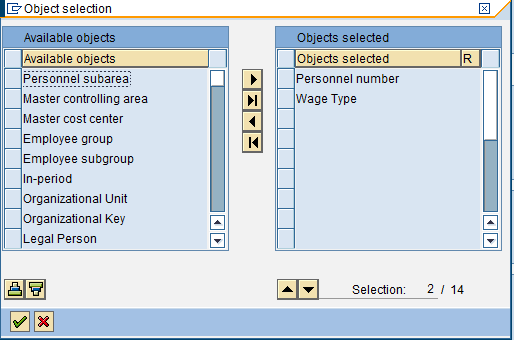
Figure 3
Objects selected using the wage type reporter
Step 2. Click the green checkmark icon to accept the changes and then execute the wage type reporter by clicking the execute icon or pressing F8.
Step 3. Next, simplify the output further by restricting the fields to be displayed in the SAP list viewer report output. Click the change layout button circled in Figure 4.

Figure 4
Change layout button in the wage type reporter
Step 4. Change the fields to be displayed by moving the unwanted fields to the Hidden fields column on the right by using the right arrow (Figure 5). Only the Personnel Number, Name of Employee or Applicant, Wage Type number, Wage Type Long Text, and the Amount are required here.
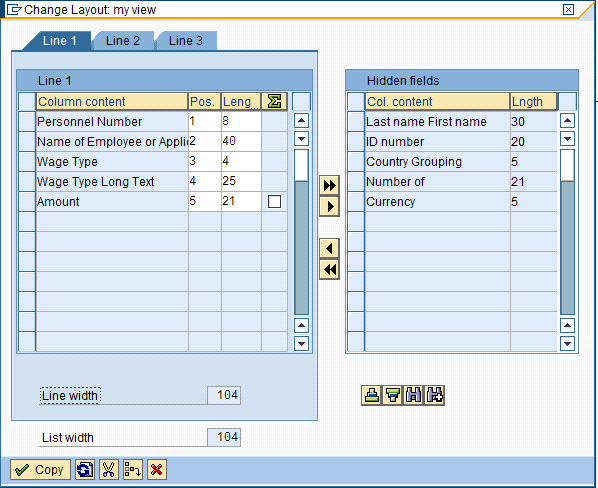
Figure 5
Choosing the fields to be displayed in the SAP list viewer
Step 5. Click the Copy button to accept the changes. The report should now be displayed as in Figure 6.

Figure 6
Sample output from the wage type reporter with revised layout
Step 6. Save the changed layout for future use by pressing the save layout button (circled in Figure 7).

Figure 7
Save layout button in the wage type reporter
Step 7. Give your layout a title and description. In this example, I have saved the layout with the title /WT_COMP so I know it refers to the wage type comparison task (Figure 8). Save this layout by pressing the Save check box.

Figure 8
Save layout
Step 8. Now back out of the displayed results in the wage type reporter by pressing the green back arrow until you return to the selection screen.
Step 9. Add the layout variant to the wage type reporter selection screen by typing the name of the layout variant you saved in step 7 ( e.g., /WT_COMP) into the SAP list viewer Layout Variant field, shown in Figure 9.
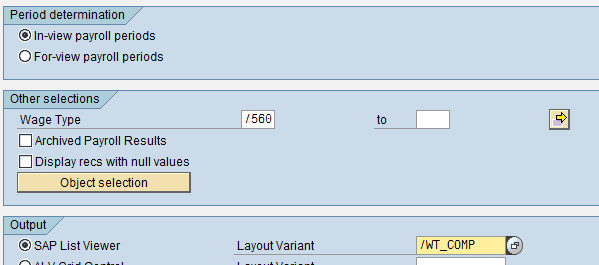
Figure 9
Adding the Layout Variant to the wage type reporter selection screen
Step 10. Now save everything set up so far as a wage type reporter variant by pressing the save button, circled in Figure 10.

Figure 10
Saving the wage type reporter variant
Step 11. Give the variant a title and description (Figure 11) and save as normal.

Figure 11
Wage type reporter variant attributes
Step 12. You have now set up a re-useable variant of the wage reporter with a simplified layout. Run the report with this variant. View the results in Excel by pressing the Excel button in the toolbar, indicated by the arrow in Figure 12.
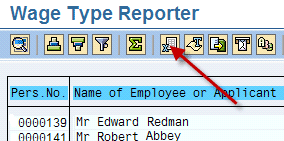
Figure 12
Excel button in the wage type reporter
Step 13. Excel is launched and displays the SAP report in an Excel worksheet. Save this workbook on a local or network drive; for example C:Old_wagetype_results.xls. These are the old results (i.e., they represent the payroll results before any configuration changes are made).
Step 14. In this step, configuration changes are applied to the regression test client. In other words, whatever changes to the payroll system that required a regression test in the first place (i.e., support packs or upgrades) are now transported to the regression test client. This could involve a number of transports created by you and/or other HCM/payroll consultants. These transports will be moved by the Basis or SAP NetWeaver team.
Step 15. Re-run the payroll in the regression test client for the same set of employees for whom you have already extracted payroll results to make sure that the configuration changes applied in step 14 are picked up by the payroll schema.
Note
For the purposes of this article, I assume that you already know how to run the payroll so step-by-step descriptions of this stage are not included here.
Step 16. Navigate to the wage type reporter using transaction code PC00_M99_CWTR, select the variant you saved in step 11 (/WT_COMP), and press execute. Repeat steps 12 and 13. Save this workbook on a local or network drive; for example C:New_wagetype_results.xls. These are the new results (i.e., they represent the payroll results after the configuration changes have been applied).
You now have two sets of results: one before the change and one after the change. The remainder of this article shows how to set up an Excel-based utility to compare these results. All the remaining steps take place outside of the SAP system using Excel.
Note
There are different versions of Excel. This article describes how to run this comparison using Microsoft Office 2007, although you might find there are minor differences if you’re using an earlier or a later version. You may also find that the VBA for Excel development environment was not originally installed. If this is the case, you may need to install additional components using the Add or Remove Programs option in the Control Panel, using your original Microsoft Office installation CD. You can easily find more detailed instructions on this by doing an Internet search. Alternatively, if you have a standard build in the workplace, your IT support desk should be able to help.
Step 17. In Excel, ceate a new blank workbook. Choose Save As and give the workbook a name (e.g., regression test) and choose Excel Macro-Enabled Workbook (Figure 13). This is only applicable to Excel versions 2007 onwards; for earlier versions, save as a normal .XLS workbook.
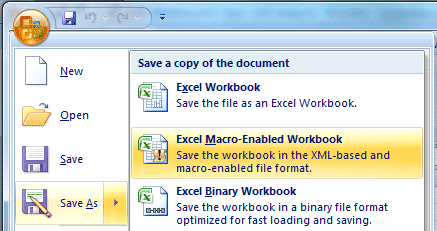
Figure 13
Create a new Excel Macro-Enabled Workbook
Step 18. Rename one of the worksheets “Old.” Note that the first letter is capitalized and that there are no spaces, as this worksheet name will be hardcoded into the VBA script.
Step 19. Open the Old results workbook that you saved in step 13 (C:Old_wagetype_results.xls in my example). Copy and paste all the values into the Old worksheet of the regression test workbook you created in the previous step. The results should look something like the screen in Figure 14.

Figure 14
Old results worksheet in Excel
Step 20. In the same workbook rename one of the worksheets “New.” Again, the first letter is capitalized and there are no spaces in the name, as this worksheet name will be hardcoded into the VBA script.
Step 21. Now open the results that were saved after the configuration changes had been applied, and the payroll re-run in step 16 (C:New_wagetype_results.xls in my example).
Copy and paste the new results into the New worksheet.
Step 22. Turn on the VBA developer environment. There are two options: either hold down the Alt and F11 keys, or click the round Office button with the Windows logo in the top left corner and go to Excel Options > Popular and check the Show Developer tab in the Ribbon check box (Figure 15).

Figure 15
VBA developer option in Excel
You should then see a new tab in the ribbon called Developer (Figure 16).

Figure 16
New Developer tab in Excel
Click the Visual Basic icon on the left to go into the Visual Basic environment.
Step 23. This results in the screen shown in Figure 17. This is the VBA development environment.
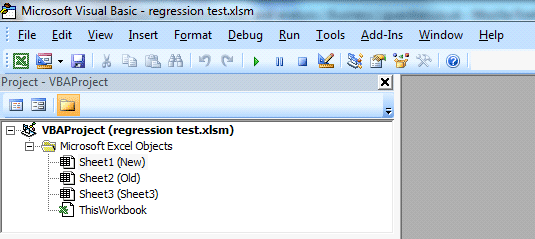
Figure 17
Excel VBA development environment screen
Step 24. The screen is normally divided into three or more sections. To add some VBA code to the workbook, click the first line in the project window (shown in bold), i.e., VBAProject (regression test.xlsm), and then select Insert > Module (Figure 18).
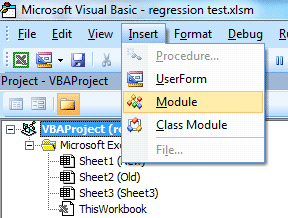
Figure 18
Insert a VBA Module into a workbook
This creates a large blank area to the right of the project window. This is the space in which you can write the VBA commands (Figure 19).
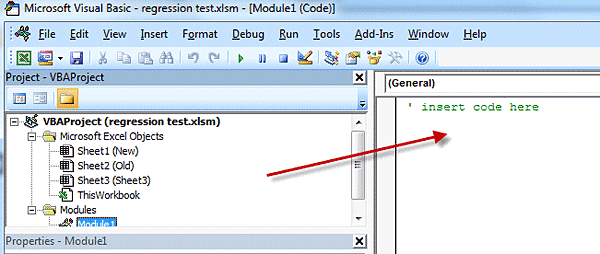
Figure 19
Where to insert VBA code into an Excel workbook
Step 25. To insert the VBA code, copy and paste the code given in Appendix A (at the end of this article) into the code window.
Step 26. Save the workbook by clicking the save icon.
Step 27. Click the Excel icon at the top left of the toolbar to exit the VBA development environment and return to normal Excel.
Step 28. To run the VBA program choose View > Macro > View Macros. Double-click the highlighted compare_two_worksheets line or click the Run button (Figure 20).
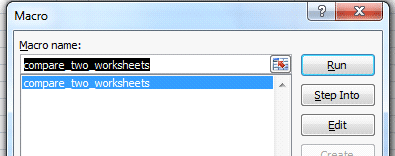
Figure 20
Select the VBA program from the macro list
Step 30. The VBA program is run by Excel. The execution time depends on the number of entries in each table and the processor speed of the PC or laptop. For a small number of entries it should run virtually instantly. For a large number of entries (e.g., 2,000) it may take a couple of minutes.
When the program has run, a new worksheet is created with the appropriate entries highlighted (Figure 21).
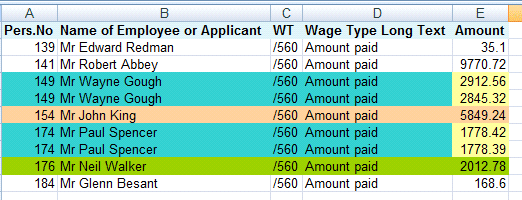
Figure 21
New Excel worksheet with highlighted entries
Next Steps
If you require a more rigorous analysis, then you can use the filter-by-color functionality within Excel to focus on any particular set of differences. This utility can compare any two tables that have the same structure. It can be used outside of the SAP system and therefore has a multitude of uses; for example:
- Verifying interface results
- Verifying custom report results
- Confirming data migration
- Comparing payroll results on legacy and SAP systems
- Checking configuration between systems that are not Remote Function Call connected
The program expects a single unique key to be in the left column (column A). If the table you are using has a key composed of several fields (i.e., it is a compound key) then the easiest solution is to insert a new column in column A and create a compound key using an Excel formula and the & operation to concatenate the key fields together (e.g., =B2&D2, shown in Figure 22).

Figure 22
Use Excel formulas to create a unique key composed of several fields
This example shows how the user can manually create a compound key in column A by typing in a formula that concatenates the personnel number and the wage type. Another alternative for modifying the VBA code is to use a key comprised of several columns.
Tip!
If you add a key field as shown above, make sure that you add this to both the New and the Old worksheets to avoid problems. It’s also a good idea to sort each worksheet on the new key you set up to prevent problems and to speed up the comparison.
Security Precautions
VBA-enabled workbooks are a serious potential security hazard. The powerful abilities of VBA have been used by virus writers to create malicious code. As a result, Excel will by default automatically disable all VBA-enabled workbooks and prompt the user to enable their usage. Make sure that you never use VBA-enabled workbooks from any sources of which you are not 100 percent sure do not present security hazards. If your version of Excel has been set to prevent macros and VBA from running then you may need to change the default settings and enable VBA (macros). To do this, do the following:
- Click the Microsoft Office button and choose Excel Options
- Choose Trust Center and then click the Trust Center Settings button (Figure 23)
Alternatively if you have the developer ribbon displayed as in step 22 (Figure 16) you can click the Macro Security button.
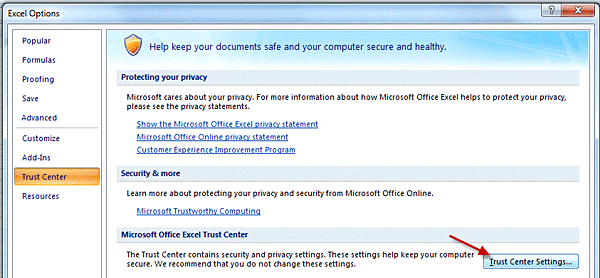
Figure 23
Access Excel Trust Center Settings to change security settings
Select the Disable all macros with notification radio button (Figure 24). This prompts Excel to ask you for confirmation whenever a macro or VBA program is run. (For earlier versions of Excel, this menu path may work: select Tools > Macro > Security > Medium.)

Figure 24
Change Excel VBA-enabled workbook security settings
Appendix A
'global options
Option Explicit
Option Base 1 Public Sub compare_two_worksheets() ' declare all variables and objects
Dim wks_new, wks_comparison As Worksheet
Dim rng_old, rng_new, rng_find, rng_target, rng_row, rng_cell As Range 'initialisation
Application.ScreenUpdating = False 'copy the old worksheet and give it a name
ThisWorkbook.Worksheets("Old").Copy Before:=Sheets(1)
Set wks_comparison = ThisWorkbook.Worksheets(1)
wks_comparison.Name = "Comparison on " & Left(Date, 2) & Mid(Date, 4, 2) & Right(Date, 4) & " at " & Left(Time, 2) & Mid(Time, 4, 2)
Set wks_new = ThisWorkbook.Worksheets("New")
'set range values
Set rng_old = wks_comparison.Cells(1, 1).CurrentRegion
Set rng_new = wks_new.Cells(1, 1).CurrentRegion 'First loop through all rows in the Old worksheet to look for a matching entry in the new spreadsheet
For Each rng_row In rng_old.rows
Set rng_find = rng_new.Range("A:A").Find(What:=rng_row(1).Value)
If rng_find Is Nothing Then
rng_row.Interior.ColorIndex = 40
Else
Set rng_find = wks_new.Range(wks_new.Cells(rng_find.row, 1), wks_new.Cells(rng_find.row, rng_old.Columns.Count))
For Each rng_cell In rng_row.Cells
If rng_cell.Value <> rng_find(rng_cell.Column).Value Then
If rng_target Is Nothing Then
Set rng_target = rng_old.Cells(65536, 1).End(xlUp).Offset(1).Resize(1, rng_old.Columns.Count)
rng_target.Value = rng_find.Value
rng_row.Interior.ColorIndex = 42
rng_target.Interior.ColorIndex = 42
End If
rng_cell.Interior.ColorIndex = 36
rng_target(rng_cell.Column).Interior.ColorIndex = 36
End If
Next
Set rng_target = Nothing
End If
Next
'Second loop through all rows in the new spreadsheet to look for a matching entry in the old spreadsheet
For Each rng_row In rng_new.rows 'loop through old
Set rng_find = rng_old.Range("A:A").Find(What:=rng_row(1).Value If rng_find Is Nothing Then
Set rng_find = rng_old.Cells(65536, 1).End(xlUp).Offset(1).Resize(1, rng_old.Columns.Count)
rng_find.Value = rng_row.Value
rng_find.Interior.ColorIndex = 43
End If
Next
'sort the spreadsheet on column 1
wks_comparison.Range("A1").Sort Key1:=wks_comparison.Columns("A"), Header:=xlGuess
wks_comparison.Range("A1").Columns.AutoFit 'switch screen updating back on
Application.ScreenUpdating = True
End Sub
|
| Appendix A |
Table comparison utility code |
Owen McGivney
Owen McGivney is a senior consultant at iProCon Ltd., part of the iProCon group, based in London, England. He has worked on implementing SAP HR and payroll systems since 1998. Owen has delivered UK, Irish, and multi-national payroll solutions for a wide range of private- and public-sector clients. He has a special interest in combining ABAP programming with configuration to create innovative and effective solutions.
You may contact the author at o.mcgivney@iprocon.com.
If you have comments about this article or publication, or would like to submit an article idea, please contact the editor.


