SAP NetWeaver BW has a little-known transaction called the query definition tool that provides a comprehensive view of any query. Discover where to find this tool and how to use it to your advantage.
Key Concept
The query definition tool provides one place to view all relevant details about a query without going into BEx Query Designer. The tool enables you to view the details of the query on one screen, rather than having to view the details over several BEx Query Designer and Query Monitor screens. The query definition tool offers a good place to troubleshoot, analyze, or document queries.
Typically, if you want to view all the data for a query, you have to go to several screens in BEx Query Designer. You then must also gather data from the Query Monitor (transaction RSRT). However, you can use the query definition tool instead to view these details on just one screen.
The query definition tool is available only on SAP NetWeaver BW 7.x. I’ll show you where to find this tool and provide tips for using it.
Note
SAP recommends that you use this transaction with a minimum of SAP NetWeaver BW 7.0, Support Package 17 because several enhancements and fixes were put into this Support Package for the query definition tool.
Access the Query Definition Tool
To run the query definition tool, use transaction RSRTQ (Figure 1). You can also access the tool by running program RSRQ_QUERYDEFINITION via transaction SA38.

Figure 1
Query definition tool accessed via transaction RSRTQ
When you run the query definition tool, the system prompts you for a query for the system to provide detailed output. You can manually fill in a query or press F4 and select one from the drop-down menu. The system provides the same selection options as in the Query Monitor (transaction RSRT). You can find queries via InfoAreas, Roles, or Favorites — or use the Find to search. The query definition tool provides analysis for any type of SAP NetWeaver BW query, such as queries from MultiProviders, InfoCubes, DataStore objects (DSOs), and InfoSets.
The query definition query prompt allows you to enter two query parameters (Figure 1).You can enter one query for Parameter 1 and a different query for Parameter 2. Although the system does not show the detailed information for the two queries on one screen, it is easy to toggle between two queries and their analysis by using the Parameter 1 and Parameter 2 prompts. The system saves the query name in each parameter while you are looking at the other query.
After you choose a query, the tool has a series of check boxes to include or exclude a series of the output options available:
- Filter: Shows all the characteristic restrictions and default values that have been added to characteristics in the query
- Rows/Columns: Displays the various key figures and characteristics that are found in the row, column, and free characteristic areas of the query
- Cells: Displays any cell calculation configured and used within the query
- Table View: Details the table views that are shown in the query
- Input Variables: Shows the variables that are defined for the query
- Exceptions and Conditions: Displays any exceptions or conditions that have been created for the query
After you specify a query — and if all the aforementioned boxes are checked — the system displays the entire query definition for the query (Figure 2). The first thing the system shows is the InfoProvider and its properties. If the InfoProvider is an InfoSet or InfoCube, it shows the description and technical name. If the query has been built on a MultiProvider, the query definition tool provides the name of the MultiProvider plus all the associated InfoProviders (Figure 3). If any associated InfoProvider is not active, the icon for the InfoProvider is grayed out.

Figure 2
Output of transaction RSRTQ with all the options checked

Figure 3
MultiProvider output with all the InfoCubes listed
If the check boxes are selected, the query definition tool then shows the various filters and default values associated with the query. By checking the Filter option, the system displays all the filters that have been applied to the query characteristics along with any default values in the query.
Note
Filters that are entered into restricted key figures are not shown if the Filter option is checked. You can see the key figures if you check the Rows/Columns option.
The tool then displays the columns, rows, and free characteristics that have been defined in the query. This information can be useful if you need to compare two queries to determine which data they share. It can also be useful for documentation purposes. For example, if you have two like queries differing in some characteristics, you could use this tool to determine which characteristics are being applied. If selected in the main screen, the tool then displays any cell calculations, table views, and input variable selections.
Additional Output Options
Along with all the characteristics, key figures, and variables, the query definition tool also can show you the query’s technical and performance settings (Figure 4). This long list of settings would require going to multiple screens and transactions to aggregate the data together into one view. This data provides read mode, cache settings, and properties from the transaction RSRT technical information. This can be useful for an overview of the performance settings of a query. It also allows you to check to ensure the query is following acceptable standards for read mode and cache, for example. To see the screen in Figure 4 select the Show Properties check box in Figure 1 after entering your query in transaction RSRTQ.

Figure 4
Select the Show Properties check box to view this screen
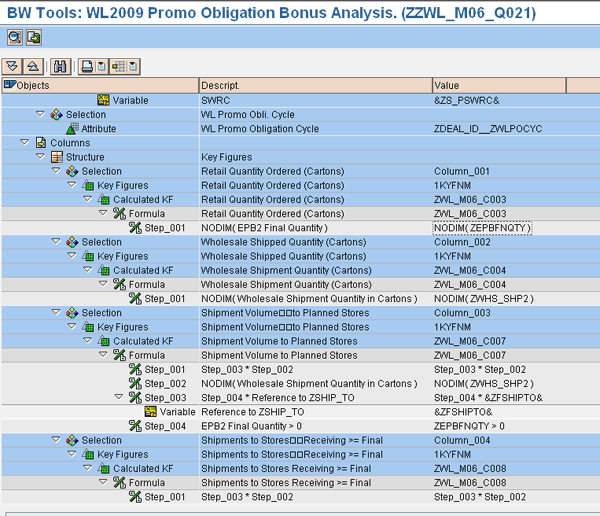
Another feature of the query definition tool is that it can show the expanded key figure definition. This option provides a more detailed analysis of the key figure by showing the setup of the key figures that have been defined (Figure 5). To see the key figure details, choose your query and select the Expand Key Figure Definition check box in Figure 1. This enables you to see the detailed restrictions and calculations of any global restricted or calculated key figure.

Figure 5
Output with the Expand Key Figure Definition option chosen
The key figure definition can be useful when you have a query with a large number of detailed key figures to analyze. To compare or verify these key figures in the query designer tool, you need to expand and look at each key figure individually. This can take a rather long time, plus there is no easy way in the query designer tool to see multiple key figure details together on one screen.
You can download data from the query definition tool by clicking the download icon or by pressing F9. This allows you to save the query data to a spreadsheet, HTML, or .RTF file. You can then incorporate the detailed documentation about the query into other documentation, save it, or print it.
Technical Information
The query definition tool also provides three separate views to show technical information about the query. You can select these options by choosing one of the three check boxes in the Technical Information area in Figure 1.
- Technical Names: This is the default option and shows the common technical name of the shown value (Figure 2). For example, the value for the InfoCube shown in the value field is the technical name of the InfoCube ZMSA_R04.
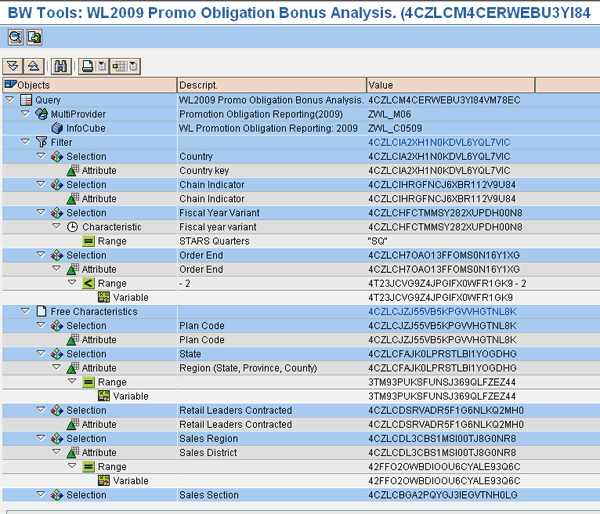
- Unique IDs: This option shows the internal GUID in the Value column (Figure 6). The GUIDs represent the internal value that is stored for each record. This can be used for troubleshooting.
- Change Log: The Change Log option shows the date the global calculated or restricted key figure was created or changed (Figure 7). This can be useful for audit purposes for comparing when and which user changed a key figure.
Note
The change log option only works with global restricted and calculated key figures. It does not work with local formulas. Local formulas show the value of 00/00/0000.

Figure 6
The GUIDs are shown in the Value column when the technical option Unique IDs is chosen

Figure 7
The last change log date is shown in the Value column when the technical option Change Log is selected
Note
For additional information on the query definition tool, refer to SAP Note 1134023.


