Get detailed information about three important wage type configuration reports: RPDLGA20, RPDLGA40, and RPDLGA00.
Key Concept
This article refers to T512W as the main wage type table. You can best view table T512W in transaction SM30 via V_512W_O, which holds key attributes of a wage type used in payroll processing and tables T503 and T512Z. I refer to these tables as main wage type tables because they appear in multiple nodes in the IMG (although sometimes with different views and therefore some data is hidden).
HR professionals often configure wage types as part of a new implementation or post-implementation to add additional payments or deductions, or new notational wage types that record on costs. They want to know why a particular wage type does not work the same as another wage type that they think is configured the same way.
Perhaps you have configured a new personnel area subarea or employee group subgrouping and want to know all wage types valid for existing groupings. You may also want to know for which infotypes wage types are available. You can answer questions including whether or not a processing class is correctly configured and which wage types contain a particular cumulation, evaluation, or processing class specification by running three reports for main wage type tables: RPDLGA20, RPDLGA40, and RPDLGA00.
Three types of reports are vital for configuring wage types. While RPDLGA20 is well known and appears in the SAP Easy Access Menu, the RPDLGA40 and RPDLGA00 reports are not as well known, nor do they appear on the menu. These reports help analyze wage types in an implementation and support environment. RPDLGA20 and RPDLGA40 concentrate on the attributes of wage types contained in table T512W. RPDLGA00 shows wage type assignment details to enterprise structure elements (personnel area/subarea and employee group/subgroup) and infotypes. The reports do not allow for analysis of the wage type characteristics table T511 used to control the input and display of wage types on infotypes or table T51P6, which controls the characteristics of deduction wage types.
These reports answer several important questions, such as: How do I see all wage types that have a particular cumulation, evaluation, or processing class specification? Why are two wage types behaving differently in payroll? Which wage types are available for input on a particular infotype? Which wage types are available for a particular employee grouping or personnel area subarea? I’ll walk you through each of the three reports and provide helpful navigation tips and explanations.
RPDLGA20
Report RPDLGA20 shows all processing, cumulation, evaluation classes, and valuations bases available for a wage type. The report details for each specification those wage types that have the same setting. This report is best suited for viewing all wage types that have a particular setting. For example: Which wage types accumulate to deductions /110? Which wage types are factored by wage type /801? Which wage types are taxable? For the above questions, you must already know the cumulation or specification of the processing class or evaluation class. To display processing classes, execute report RPDLGA20 (Figure 1). You can also find this report on the SAP Easy Access screen under Payroll>Tools>Customizing Tools>Wage Type Utilization. Double-click on Meaning of processing classes and their values (Figure 2). You’ll see the screen in Figure 3.

Figure 1
RPDLGA20 selection screen


Figure 3
Processing classes and their specifications
Figure 1 is the selection screen for the report where you can select the country grouping wage types and validity dates that apply to you. You might enter this report to analyze configuration of wage types for production errors, reconciliations, or new configuration. The validity dates are important because your SAP system allows you to change the attributes of a wage type from a particular date. If the validity dates are blank, then you may not receive the correct settings for the period you are investigating.
If you select Display logical views in Figure 1 after the report is executed, then you can go directly to the IMG step for a wage type characteristic. This only works when run in Tables or Tree Structure.
Figure 1 offers three options: Tables, Tree structure, or Continuous list. Your choice depends on how you prefer to view information. For instance, in table structure further information is provided by double-clicking. In the tree structure, you need to expand nodes. In the continuous list, the user must scroll up and down. I find the table structure the easiest to use, but if I want to look at wage type assignments to multiple specifications simultaneously, then I use the tree structure. The only time I use a continuous list is when I am downloading to Excel, though considerable data manipulation is needed.
Note
When the validity range is large and wage types have been delimited, characteristics that are no longer valid or only valid in the future may be displayed, as the output of the report does not show date ranges. It is therefore important to carefully consider the validity dates being used. Typically, the validity dates would be the current payroll period. However, if a retrospective payroll problem is being investigated, the dates may need to change.
Figure 2 shows the output when you execute report RPDLGA20 in table structure. In this screen, double-click on the attribute you are interested in for further analysis. Lists of different specifications are behind each attribute that you can assign to individual wage types.
Figure 3 is the output when you choose processing classes. Double-click on the processing class specification (any line under the highlighted processing class name) for results of all wage types with that specification. In this instance, you are examining all wage types with a particular processing specification. For example, if I click on the line with value 3, I will see all wage types that make up my valuation bases 01 and 02. When you double-click on a specification from Figure 3, you see the screen in Figure 4. This screen shows all wage types with the processing class set to specification 1.
Note
As the text of all possible processing classes and specifications are output, you can use Ctrl+F to see if a certain functionality uses a processing class. You may be looking to see how a wage type is taxed. By using Ctrl+F and typing tax you find that processing class 21 is used to specify how an Australian wage type is to be taxed. This is also available when expanding other characteristics such as cumulation and evaluation classes.

Figure 4
All wage types with processing class 01 set to 1
To save the output to Microsoft Excel, use menu path System>List>Save>Local File. You may want to record this in Excel for further manipulation or distribution to other people in your organization.
To display the IMG steps to configure the characteristic of the wage type that the cursor is on, click on the Logical view button shown in Figure 3. Double-click on the IMG access line labeled Define advance pay for wage types to go to the IMG (Figure 5). This brings up the pop-up window that Figure 6 shows. Click on Continue w/o Specifying Project to go to the IMG (Figure 7). You can now configure processing class 65.
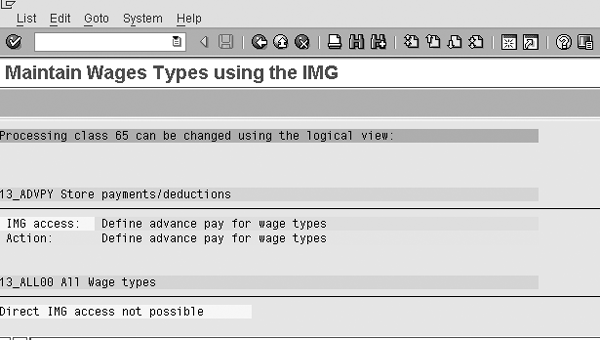
Figure 5
IMG step to configure processing class 65

Figure 6
IMG project

Figure 7
IMG activity for Advance Payments
The tree structure output (Figure 8) is an efficient way to analyze a processing class and all wage types for multiple specifications. You arrive at this screen by running the report in Figure 1 and choosing Tree structure. For example, you may want to see all wage types that have an entry for processing class 1. Figure 8 shows that no wage types are assigned to specification 2. In the table view, you would first need to double-click on this specification to reveal that no wage types are assigned.

Figure 8
Tree structure output
RPDLGA40
Report RPDLGA40 (T512W Cumulations, Evaluation Classes, and Processing Classes) shows you the specifications for each processing class. It reports on the same characteristics as the above report. However, because of the way the output is displayed, it is easier to compare wage types. This report is best to use when you are comparing a number of wage types to see why they are behaving differently in payroll. Until I was aware of this report, I would compare screen dumps of table V_T512W_O.
The previous report RPDLGA20 is easiest to use when you want to see what wage types are assigned to a cumulation or a particular specification for a processing class.
Figure 9 shows the selection screen for this report. This is not on the SAP Easy Access Menu, so you need to run report RPDLGA40 via transaction SA38. In this screen, you can specify for which wage types the report should be run, the wage type code or text that can be used, and the country the wage types are for. You can sort the results according to the Wage type text (T), Wage type code (L), Start Date (B), or End Date (E) of the wage type. The report is best run with the text for cumulation wage types selected, because the output is easier to read.
Note
If you select the Automatic operation mode from the selection screen (Figure 9), the output result is a continuous list of cumulations, processing classes, and evaluation classes for each wage type. Options to display these attributes separately on each page are not available. You may prefer to navigate using the up and down keys on your keyboard rather than going back to the screen displayed in Figure 10.

Figure 9
Selection screen for RPDLGA40
After executing the report from Figure 9, you can see the cumulation overview in Figure 10. This screen shows the cumulations against which each of the wage types are attached. It is very useful to notice if some wage types are delimited as these dates do not appear for the evaluation and processing classes.

Figure 10
Specific cumulations
For the wage types you selected in Figure 9, you can see the specification assigned for each processing class. To do so, click on the Proc.class overview button in Figure 10 to display the output of each processing class and specifications for the wage types (Figure 11). You can see that wage types 4001 and 4002 share the same specification 0 for processing class 01. While 1002 has specification 3 assigned, 4001 appears multiple times. A delimitation is specified during the wage type validity dates on the selection screen in Figure 9.
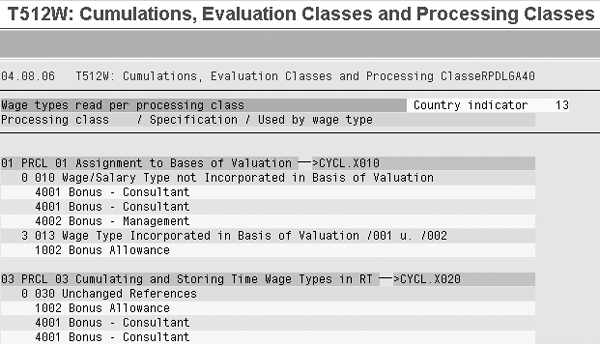
Figure 11
Processing class specification
Click on the green arrow back button to take you to Figure 10. From here, you can select the Eval.class overview button to display evaluation classes (Figure 12).

Figure 12
Evaluation class specifications
This screen displays evaluation specifications for wage types. Evaluation classes are used on forms and reports. This report shows the specifications for each evaluation class for the wage types elected in the selection screen. On this screen, you can see that for evaluation class 02, wage type /BGT has specification 00. In addition, wage type 1002 has specification 02 against processing class 01.
RPDLGA00
Report RPDLGA00 (Wage Types from Table T511 or T512T) is ideal for determining for which groups of employees and personnel areas wage types are available and on which infotypes wage types are input. You can use it during an implementation to check that wage types are assigned per the blueprint to the correct groups of employees and that they appear on the correct infotypes. Post-implementation, this report is useful to review prior to copying a wage type to make sure only the correct employees will be able to use the new wage type. It is also useful to review this when enterprise changes are occurring and the wage type assignments to employees need adjusting.
This report brings together the configuration of tables V_503_G, V_001P_K, and T512Z. This saves a functional professional from having to download or review multiple tables. You can view this report via transaction SE38 or SA38 and typing RPDLGA00.
As with the above reports, you can select wage types using the wage type code or text and the country grouping. You can sort the results according to the Wage type text (T), Wage type code (L), Start Date (B), or End Date (E) of the wage type. Each wage type has a four-character code, 4002 for example. The wage type text held in table T512T is a description of this code Bonus – Management. The configuration of wage types attributes (such as processing, evaluation classes, cumulations, and mappings to groups of employees and personnel areas) can change over time. These attributes can be valid from specific dates. The start date is the beginning of the validity period and the end date is the end of this validity period.
Automatic mode also displays the infotypes to which the wage types have been assigned. After selecting the automatic mode, below each wage type you see the infotypes on which you can input the wage type. If you choose not to select this, after the report is run you need to place the cursor on the wage type and select the infotype button at the top of the report.
If you select Read wage types from T511, then the system only selects wage types with T511 settings. If you leave this blank and a wage type exists in T512T and not in T511, the message not in T511 appears. Table T511 holds the attributes for how a wage type is displayed on an infotype (e.g., a minimum and maximum amount or number/unit input). If the wage type is assigned to an infotype but is not in this table, then a user is not able to input the wage type. When running the report you can report on all wage types or just those that have been configured in T511.
After executing the report in Figure 13, you arrive at the screen in Figure 14. This screen shows details about four bonus wage types. It includes the infotypes and the employee group subgrouping and personnel area/subarea grouping for which this wage type is valid. These groupings can be seen in views V_001P_K and V_503_G. In this example, wage type G031 can be entered on infotypes 0014 and 0267, or wage type 4002 can be entered in infotype 0015. Note there is no validation about whether you should assign a wage type to an infotype. For example, no wage types are input on 0227 because infotype 0027 does not contain a field for wage types. However, there has been configuration to say that G031 can be input. This does not matter to users because the wage type does not appear for infotype 0227. However, it can make reading the report messy and harder to use.

Figure 13
Selection screen for report RPDLGA00

Figure 14
Employee and personnel grouping and infotypes
I have mainly used report RPDLGA00 to see what employee subgroup grouping-primary wage types (defined in table V_503_G) and Personnel subarea for primary wage type group (defined in table V_001P_K) wage types are available. I use this information to report which wage types are available to groups of employees based on employee group/subgroup or personnel area/subarea. When you want to limit the wage types to either personnel areas/subareas or employee groups/subgroups, you first group each personnel area/subarea into a personnel grouping or personnel subarea grouping for wage type maintenance (see view V_001P_K).
A similar process is needed for employee group subgroup in view V_503_G, where employee group/subgroup is assigned to an employee subgrouping for wage type maintenance. Once the report is run, I am able to download to Excel. In the sidebar, “How to Extract the Report Output into Excel,” I’ve provided tips about how to best extract report output into Excel. You can apply these hints to the three reports I explained in this article in addition to other reports.
How to Extract the Report Output into Excel
To analyze report data, I often download the reports to Excel and need to manipulate the columns. When exporting to Excel, it is best to run with Automatic mode disabled. Otherwise, the infotypes are listed under the text of the wage types. Because the first column to the left of where the infotype is listed does not contain the wage type, you encounter a problem when you import the data to Excel. When sorting by wage types, the infotypes will not be reported against a wage type.
To save the report output to Excel, follow menu path System>List>Save>Local File (Figure 1). Choose unconverted and click on the enter icon to go to the screen in Figure 2. Enter the file location and name.
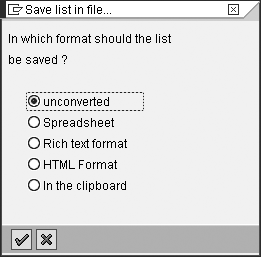
Figure 1SB
Output options

Figure 2SB
Save to directory
From Excel, open the file. If you open a text document from Excel, the import wizard appears (Figure 3). In step 1, select Fixed width and click on the Next button. The fixed width setting allows users to determine where column breaks should occur. In this example, I have left the automatic mode on and you can see the infotypes for each wage type.

Figure 3SB
Import text file into Excel

Figure 4SB
Column placement
In step 2, place lines at columns 4, 34, 44, 55, 58 to 67, and 69 to 79 (Figure 4). Select Finish. These lines mark the beginning and end of important information. Wage type code finishes at column 4, text at 34, start date at 44, and so on.

Figure 5SB
Output in Excel

Figure 6SB
Final format in Excel
Isaac Berkovits
Isaac Berkovits is an SAP consultant with Presence of IT. He has been configuring SAP for more than seven years. Isaac has worked on implementations and support in telecommunications, materials, health, government, financial, and manufacturing industries, located primarily in Australia and New Zealand and also across Asia Pacific.
If you have comments about this article or publication, or would like to submit an article idea, please contact the editor.