Find out about the Analysis Process Designer capabilities in SAP BW that allow you to analyze and group data from mySAP CRM. See how you can create CRM target groups with SAP BW data to organize customer-related activities and process them for specific customer groups.
Key Concept
With Analysis Process Designer, you can create data flows graphically, from simple filter operations to complex data mining applications. By applying ready-to-use algorithms, the system selects the appropriate business partners, which you can then transfer into CRM target groups.
Imagine you are a book publisher. You sell books to bookshops that in turn sell the books to customers. The bookshops that order your books differ in size, targeted customers, and location. Although you keep track of the number and kind of books you sold to the bookshops, you would like to segment the bookshops into different groups so you can target where to sell your books (e.g., shops in more rural or more urban regions, or shops that focus on cookbooks or eastern Asia tour guides).
You could derive this information from the bookshop data you have on hand. However, if you work with Analysis Process Designer (APD) in SAP Business Information Warehouse (BW) and SAP NetWeaver Business Intelligence (SAP NetWeaver BI), you could identify more sophisticated data from the books you sold. For example, you could detect patterns such as “customers who bought this book also bought ...”
Using APD to analyze your CRM data offers several advantages. You can combine data from different sources. For example, you could use business partners’ key figures and attributes from other areas of R/3 or mySAP ERP Central Component (ECC) that contain additional information about the business partners, such as creditworthiness, payment behavior, and frequency of orders and shipments. You could also link external data, such as market data, with the data about books you sold or the bookshops’ regions.
To create target groups — the business partners you want to contact for your marketing activity — in APD you need:
- SAP BW 3.5 or higher. You can use earlier BW systems, but you need to adjust how you configure the CRM data target. For more information about this, refer to the sidebar, “Simulate CRM Target Groups with BW Releases Prior to 3.5.”
- mySAP CRM 4.0 or higher
- CRM business partners extracted into BW. All of the business partners that you want to sort into target groups must exist in mySAP CRM.
To understand how the interaction between APD and mySAP CRM works, let’s look at how to create an analysis process in which you use a graphical user interface (GUI) to create data flows without programming. Typically, both the BW and CRM teams are involved in this process. The BW team provides the extractions and the CRM team provides the knowledge about the data structures that are extracted. Both teams can create and run the process, but familiarity with BW behavior is helpful.
The APD Process
For this example, start with transaction CRM_RSDMWB in your mySAP CRM system and then click on the Analysis Process Designer button. This starts the RSDMWB transaction in BW, which in turn calls APD — transaction RSANWB in BW (Figure 1). APD runs only in BW, no matter from where you start it.

Figure 1
APD main screen
The main APD screen is separated into three areas. The left section contains folders for the different types of available analysis processes. All of the processes you create appear in their respective folders. The middle section includes all of the Data Sources, Transformations, and Data Targets available for your analysis processes. The right section contains the actual analysis process that you create by dragging the icons from the middle section and dropping them into the right section. You then connect the icons by drawing arcs between them.
Tip!
If you see only a gray space for the middle and right sections, then no one has created an analysis process on your system. The main APD screen always shows the last state, so after you create a process you should get a screen that looks like Figure 1.
Click on the blank document icon 
 to create a new analysis process. APD asks you for the Application, which means one of the folders (or subfolders) from the left side of the screen. The folders (applications) differ only in which icons are available in the middle section. For my example, I chose the Generic folder.
Next, enter a description and save the application by clicking on the save icon. The system prompts you for a technical name, then it opens the folder with the new application. Note that with the change icon  , you can toggle between the display and change states. Sometimes the system sets APD to the display state (with the left side of the screen gray) automatically, so you cannot edit anything.
In this example, I selected an InfoObject as the data source, a filter as the transformation, and mySAP CRM as the data target (Figure 2). When I drag the data source icon to the process area, APD prompts me for the InfoObject’s name and description. In this case, I assume the BW team already extracted the CRM business partners to the 0BPARTNER object in BW, so I choose this as the InfoObject. Following that, I drag the filter item and drop it into the process area on the right side of the APD screen (Figure 3).
Note
An InfoObject is the basic unit of data modeling in BW. Any data set and any attribute inside a data set is an InfoObject. InfoObjects can contain master data or you can use them to model transaction data.

Figure 2
Select the components for your analysis process
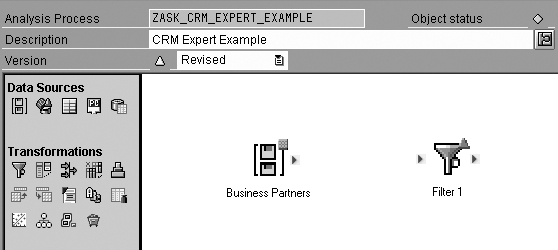
Figure 3
Drag and drop the icons from the middle section of the APD screen to the right side of the screen
Click on the arrow  on the right side of the business partners icon and move the mouse to the filter 1 icon to connect them. This sends the data from the data source through a filter and allows further transformation. You can configure the filter by double-clicking on the filter 1 icon, which brings up the Transformation Filter screen (Figure 4). Here you choose the business partner’s attributes you want the system to filter. In the Filter Conditions tab, you can define the values that are allowed for this attribute by selecting one or several of the Available Fields. For example, if you want to address business partners in Rio de Janeiro, you would create the filter shown in Figure 5.
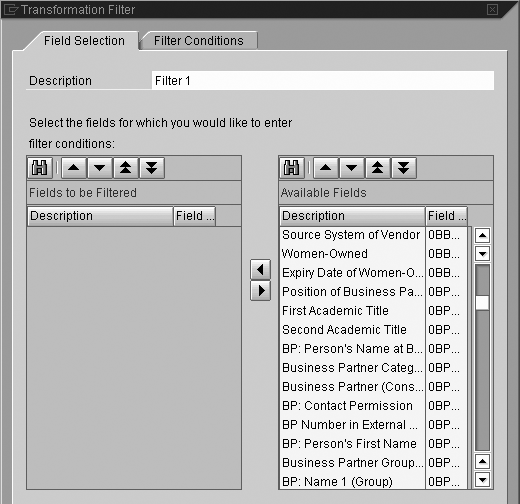
Figure 4
Configure the filter

Figure 5
Filter for business partners in Rio de Janeiro
At this point, you might want to check the input data for the business partner data source. Usually, you only can activate and start an APD process if it is complete (i.e., if it contains no open arrows and if it contains at least one data source and one data target). Fortunately, APD allows you to create intermediate results at any point of the process, even before you define it completely. Right-click to access the context menu.
You can calculate an Intermediate Result immediately or, if you want to avoid straining the system with a large data load during the day, schedule it for later. In this step, you can check whether the filter works as you expected and if the desired data is available. After the system calculates the intermediate result, you can view it as a table by choosing Display Data in the context menu.
If you calculate intermediate results at any node in the APD process, the system uses these results each time you start the APD process until you delete the intermediate result. This can cause inconsistencies in your data because the other data has been updated. To avoid this, right-click on the respective node and select Intermediate results>Delete. When the process starts again, the system uses the results produced in the current run only.
Finally, to complete this APD process you have to define a data target (where you want to send the data). For my example, I wanted to create a target group in mySAP CRM, so I chose the CRM icon from Data Targets section in the middle of the screen and dropped it into the process area on the right side of the screen. In the Data Target CRM screen that pops up, enter a Description, such as CRM Target Groups, and select the Logical System. Next, the system prompts you to log in to the specified system. After you’ve logged in, the Data Target drop-down menu becomes available (Figure 6). In this case, I selected CRM Target Group.
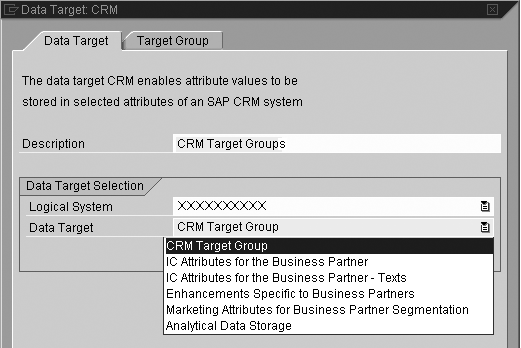
Figure 6
Enter the appropriate information for the data target
Click on the Target Group tab in the Data Target: CRM screen to define the target group that you want to create (Figure 7). Here you have to determine whether you should create a profile set — a group of marketing data — or use an existing one. To create a profile set, you need to specify a name. To use an existing profile set, choose one from the value help by clicking on the icon on the right side of the Profile Set Description field. You must decide whether to create a new target group or use an existing one. If you want to use an existing one, the chosen profile set also must exist. In this case, select the target group by clicking on the icon that appears on the right side of the Description Target Group field.

Figure 7
Define the target group
Finally, connect the filter icon and the CRM target group icon and set the connection parameters. Double- click on the field assignment icon  to bring up the Change Field Assignment screen. This screen might be confusing because the target is on the left side and the source is on the right side, but aside from that the last step is easy to perform. The system determines the Target Structure automatically — this is the case with the business partner data source because it exists in both mySAP CRM and BW (Figure 8). The APD filters a set of business partner numbers to transfer back to mySAP CRM.
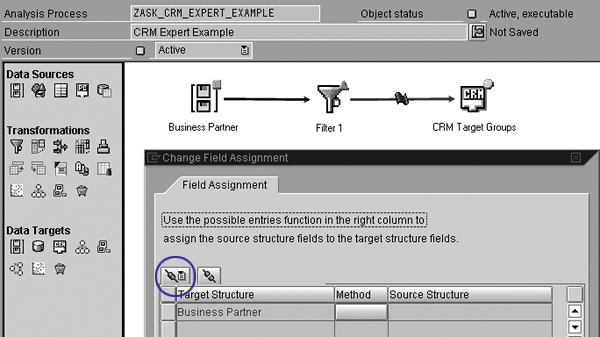
Figure 8
Connect the filter to the CRM target group
The easiest way to define the source structure is with one of the two automatic methods, Same InfoObject or Same Data Element, which you access by clicking on the automatic assignment icon circled in Figure 8.
Now the APD setup process is complete. Activate the process by clicking on the activate icon  , then start the process by clicking on the execute icon, which becomes available only after you activate the process. If your process runs for a long time, you can view its status by clicking on the monitor icon
  . This brings up the Display logs screen shown in Figure 9.
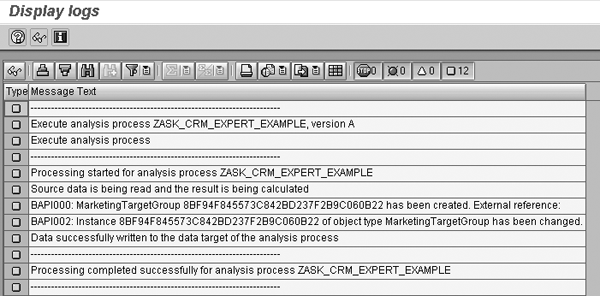
Figure 9
View the status of each process
Tip!
If you want to check the status of your process, click on the check icon

before you click on the activate icon. The check searches for errors and allows you to address them before you activate the process. This is useful on slower systems — it can save you processing time because you don’t have to activate the process each time you want to check for errors. If you are using a system with normal speed, you can just click on the activate icon, which starts the check automatically when you activate the object.
Combine Data from Different Sources
Let’s return to my earlier example of linking external information, such as market data, with the books you sold. In this case, you might have information about trends — which products or variants are currently popular. You could compare books that are similar to those in the market data to assess their potential popularity.
You can extend my example with a join operator to concatenate data from different sources. So far, I only used business partner master data from the standard object 0BPARTNER. Perhaps you have additional information about your customers in your BW InfoObjects. Or, you already may have BW reports that show key figures, such as retail sales, for the business partners. In most cases, this information is not directly available in your mySAP CRM system.
Follow these three steps to use APD to select customers that meet specific criteria stemming from other sources. With this process, you can join two data sources with a simple graphical operation that does not require any programming.
Step 1. Choose an InfoProvider. Select an InfoProvider from the data source by clicking on the InfoProvider icon circled in Figure 10. InfoProviders in BW contain characteristics and key figures such as the sales per customer in a specific region. I chose the 0CSAL_C02 (sales planning) InfoProvider from the standard BW content in the Source tab in Figure 10. It contains structures for storing sales information about customers or business partners.

Figure 10
Select an InfoProvider from the data source
Step 2. Select the characteristics and key figures and create a joined data set. After you provide the name of the InfoProvider, you have to choose the appropriate characteristics and key figures in the Field Selection tab. To keep the example simple, I chose only the business partner object 0BPARTNER and the product 0APPROD as characteristics and the net sales key figure 0COPANETSL.
When you confirm this dialog by clicking on the green check icon, you can remove the link between the business partners icon and the filter icon. Right-click and choose Delete Link. This allows you to add information — the system now filters not only the data coming from the business partner’s data source, but also the joined set of the two data sources. Then, add and link the join-transformation icon circled in Figure 11 with the appropriate icons by dragging and dropping it into the process area.

Figure 11
Add and link the join-transformation icon
Step 3. Merge the data sets. Open the Transformation Join screen by double-clicking on the join-transformation icon. The check marks in the boxes for both of the Field Name columns define the fields for the joined data sources that the system transfers among the icons between the data sources and data targets. These icons are called transformations because they transform data in a data flow. In Figure 11, the field 0REGION, which I need for the filter criterion I used, is selected but not shown.
I drew the line between the two 0BPARTNER fields manually — this defines the field in which the join operation performs. The line means I can merge a data set in the first data source with a data set in the second data source if they share the same number in the field 0BPARTNER. I marked all of the merged fields (Business Partner, Product, and Net sales) with a check mark. Following this, you can start and activate the process as you did before.
Simulate CRM Target Groups with BW Release Prior to 3.5
Although CRM target groups are only available as CRM data targets with BW Release 3.5 and higher, you can apply the CRM data target Marketing Attributes for Business Partner Segmentation in BW systems earlier than Release 3.5 to simulate the CRM data target Target Groups. The only prerequisite is that you must have defined these marketing attributes in the CRM business partner and released them for data acceptance from BW.
To release the marketing attributes, use customizing transaction code SPRO and follow menu path SAP Reference IMG>Integration with other mySAP components>Data Transfer From SAP Business Information Warehouse>Release Data Target for Replication from SAP BW. After this, you can create target groups and profile sets within mySAP CRM in the usual way.
Dr. Andre Skusa
Dr. Andre Skusa is a BW consultant for syskoplan AG and focuses on data mining and geo-marketing. Since its foundation in 1983, syskoplan has made a name for itself as a systems integrator and consulting partner for all aspects of BI and customer relationship management. syskoplan carries out software projects for major companies and sector leaders in Germany, Europe, and the United States.
You may contact the author at andre.skusa@syskoplan.de.
If you have comments about this article or publication, or would like to submit an article idea, please contact the editor.


