Learn the steps needed to set up an SAP Enterprise Information Management (EIM) task to real-time replicate and manipulate a data feed to SAP HANA from an external source database. Learn how to integrate the Smart Data Integration and Smart Data Quality transforms within EIM to clean, join, and otherwise manipulate data via SAP HANA studio or on the cloud.
Key Concept
Support Package 9 of SAP HANA introduced the new toolset, SAP HANA Enterprise Information Management (EIM). With it you can load, manipulate, and cleanse data from other databases before moving it into SAP HANA.
SAP Enterprise Information Management (EIM) is a new toolset that is built into SAP HANA with expertise in extraction, transformation, and loading (ETL) combined with the existing SAP real-time replication technology of the SAP Replication Server (SRS) in one tool. It joins a long list of other SAP tools that companies can use to load data into SAP HANA. These existing tools include Direct Extraction Connection (DXC), SAP Landscape Transformation (SLT), SAP BusinessObjects Data Services (BODS), and SRS as a stand-alone.
Although I am not in SAP product management, it is obvious that SAP HANA EIM, like any new product, is evolving. In its current state as a graphical transformation toolset and paired with real-time replication, it is a very handy tool. That said, IT system landscapes from one company to the next are very different. One day soon most companies will, I hope, and SAP hopes, have all their software running on SAP HANA. Until that day arrives, many companies have SAP products running in a heterogeneous landscape with a vast mixture of databases and applications that are non-SAP. I am sure there are more robust positioning guides somewhere on SAP.com but I could not find one. Therefore, in my opinion, if your project is very SAP HANA-centric, you should use SAP HANA EIM wherever its feature list (contained in SAP HANA EIM documentation) meets your needs, as it combines many of the cleansing and manipulation features of SAP data services, along with the real-time replication power of SRS.
Some reasons you may not be able to use it (at least as of May 2015) include, for example, the lack of support for all databases as sources. Another reason is that the feed is at the table or view level and that means you can’t leverage the BW extractors as you can with SAP’s Data Services product (BODS). For these and other features that you might need to feed into an SAP HANA environment, SAP continues to support the more established toolsets of DXC, SLT, SRS, and BODS.
SAP HANA EIM Initial Preparation and Installation Steps
Like other features of SAP HANA, SAP HANA EIM first requires a technical installation of various software components, and then the assignment of roles containing privileges to the users who will perform the EIM modeling. The best source of the tasks needed to get EIM up and running is the SAP HANA EIM Master Guide. A good starting point is to review the focused task list contained in Table 8 of the guide, an excerpt of which is shown in Figure 1.
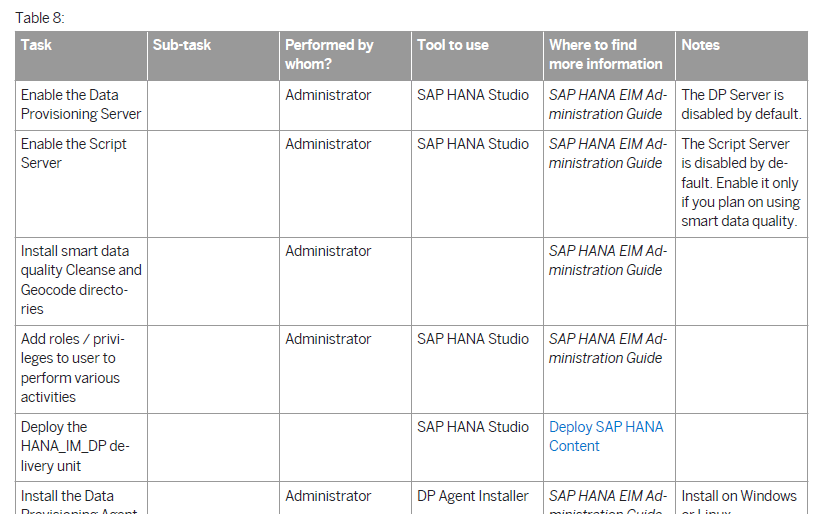
Figure 1
A (partial) list of tasks for setting up and using SAP HANA EIM
As you can see in the task list, under the Where to find more information column is a list of various guides that refer you to sources of information that show you specific steps for setting up and using SAP HANA EIM. Some of these steps are optional depending on which SAP HANA EIM features you plan to use.
After this setup, some regular development tasks need to be done. These tasks include creating a repository to allow sharing of your work with other colleagues and creating a project. Since these steps are not SAP HANA EIM-specific, I am not going to cover them in detail. That said, in brief, they include:
- In the modeler’s perspective, create a package for organizing content.
- Access the SAP HANA development perspective.
- Access the Repository tab in the developer’s perspective and create a repository with a behind-the-scenes default location for temporary storage of the objects before they are activated.
- Finally, create a project with a parent folder (e.g., the package you created in step 1) in the project Explorer tab in the development perspective.
Figure 2 shows these set-up details. Specifically, it shows a development project linked to an SAP HANA system. The project is in a package named I008705.

Figure 2
A development project prepared for an SAP HANA EIM flowgraph
Note
For more details about the development setup, follow the link shown in
Figure 2 or attend SAP training
HA350 SPS 09 Training Class.
Now that you have a folder in place in which to put your work, let’s move on to the meat of this SAP HANA EIM project… the flowgraph.
Create an SAP HANA EIM Flowgraph
SAP HANA EIM is modeled in a flowgraph object. The closest analogy for a flowgraph would be a web-based version of a BODS data flow. A flowgraph is a container that holds the step-by-step ETL process that makes up SAP HANA EIM. To create a flowgraph, access your development project and (using the context menu) choose New > Other. Then expand the SAP HANA Database Development option to open the list of available wizards (Figure 3). Select the Flowgraph Model option and click the Next button.

Figure 3
Create a new flowgraph model to package SAP HANA EIM
This opens a screen where you are prompted to supply a file name (in this example, nedf1) and the system appends the file type hdbflowgraph to the name (shown in Figure 4). Additionally, I chose the Flowgraph for activation as Task Plan radio button option. With this option, you are able to use real-time replication, as well as other options discussed in more detail in the SAP HANA EIM Configuration Guide.

Figure 4
Define a file name for the SAP HANA flowgraph model
Click the Finish button, which takes you to the Application Function Modeler GUI to assemble your ETL process (Figure 5). The initial screen shown in the figure contains the properties for the model as a whole. Subsequently each node in the ETL process will have its own processing properties, as I discuss later.
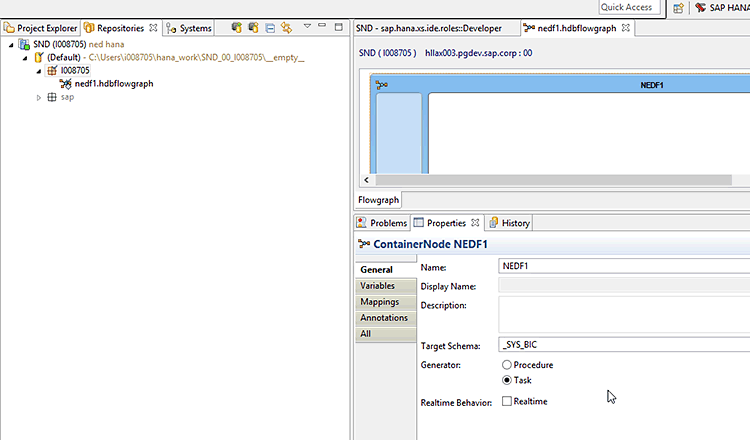
Figure 5
Overall container settings for the SAP HANA EIM flowgraph
In this first container properties pane, you are able to define which schema is involved. You have the option to run this task as a real time replication (by selecting the the Realtime check box). In this case, I don’t choose this option, but if you would like to learn more about it, here is a good HANA Academy video: ECC Replication.
Before continuing with building the flowgraph, there is one other preparatory step required. You need to create a link to a table in a remote system—a so-called virtual table. To do so you need to first establish a link to a remote source. In this case, I use a previously established remote source, HPM_800 (an ECC system running on Oracle). Details about this step are out of the scope of this article, but I have included a screenprint of the settings and the path to this remote source in Figure 6 to illustrate.
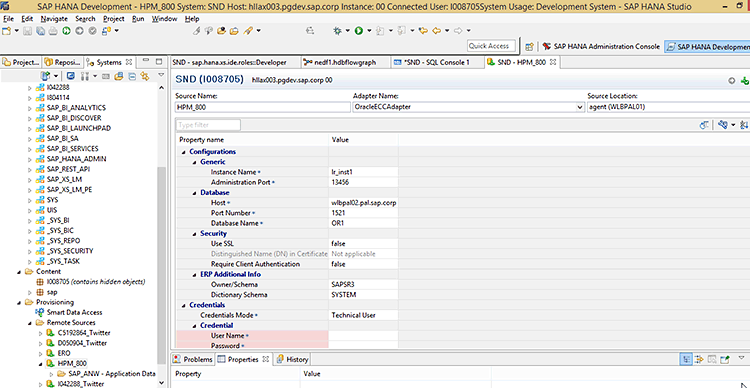
Figure 6
Create a link to a remote source of data for SAP HANA
Once the remote source is established, you can search for tables by expanding the navigation tree as shown in Figure 7.
Figure 7
Locate table KNA1 on the remote source
Once the desired table is located on the remote source (table KNA1, in my example), open the table’s context menu and choose the Add as Virtual Table option (Figure 8).
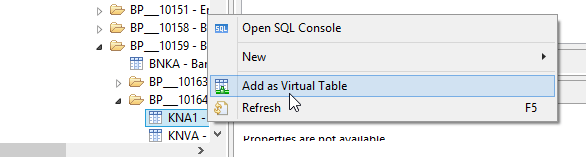
Figure 8
Create a new virtual table from a table residing in a remote source
This opens the screen in Figure 9 where you add the details for the new virtual table. In this case, I used the default table name and put it in my I008705 schema. Then click the Create button.
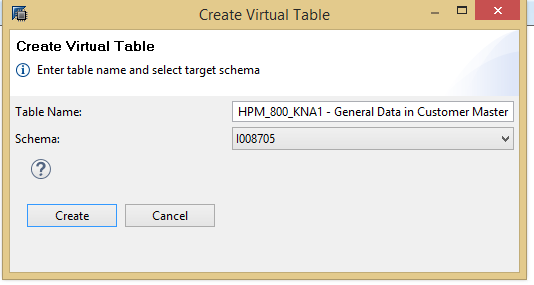
Figure 9
Create a new virtual table
This opens the screen in Figure 10 where you can see that the new virtual table now appears in the I008705 schema. The odd little green image that appears on the table icon identifies it is a virtual table.
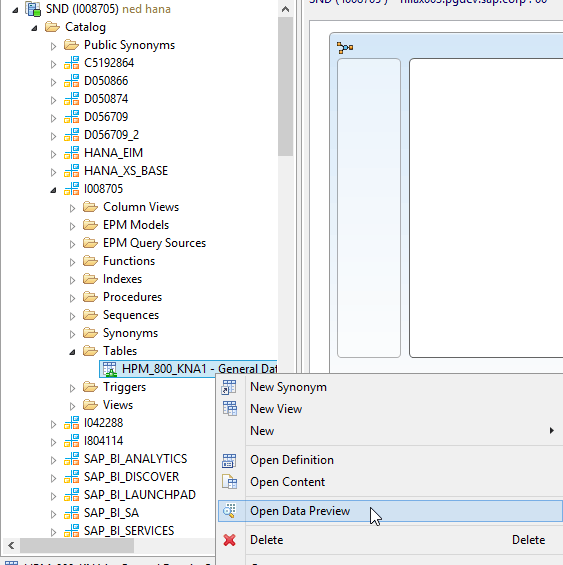
Figure 10
View the virtual KNA1 table in a database schema
Now that you have the shell and the source for your SAP HANA EIM flowgraph, you have to link all the pieces and complete a meaningful ETL process.
Build the SAP HANA EIM Flowgraph
Now that all the prerequisite steps have been completed, the next task is to assemble the SAP HANA EIM model. Return to the container (Figure 11) and you see the list of nodes of the application function modelers specifically related to SAP HANA EIM. As an aside, one cool feature is that you also have access to manipulations using transformations in the Business Function and Predictive Analysis libraries folders (a discussion for another day). If you want to learn more, follow this link: SAP HANA Predictive Analysis Capabilities.
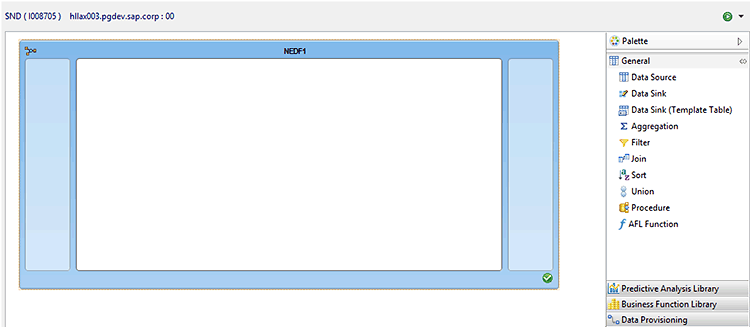
Figure 11
Available transformation nodes in the General folder
Here you can see all the available nodes (in the right pane of Figure 11). A quick summary of the transformation nodes in the General folder and what they do is listed below.
Note
The transformation nodes marked with an asterisk (*) are the ones used in this article.
*Data Source: Performs a read of data from a catalog or repository object (most often a view). In this case, since I am moving data from another system, it represents a virtual table.
Data Sink: Writes data to a table in a database schema.
*Data Sink (Template Table): First creates a table and then has the system write to it.
Aggregation: Outputs an aggregated dataset with a reduced set of columns.
*Filter: Filters the data at the row level or filters out columns that are not needed by the subsequent nodes.
Join: Joins two inputs to form a combined output.
Sort: Sorts the target data, resulting in a sorted output.
Union: Unions of two sources of data.
Procedure: This calls a stored procedure (existing code).
AFL Function: This transformation calls an Application Function Library (AFL) function
Figure 12 shows the list of transformation nodes that are categorized as Data Provisioning.

Figure 12
Flowgraph’s container and transformation nodes in the Data Provisioning folder
Here is a brief description of each node in this screen and their functions.
Date Generation: Creates a series of dates starting at the date you specify.
Row Generation: Creates a dataset with the numbers of rows you specify.
Case Node: Allows the use of a case expression which routes data to different targets.
Pivot: Switches the data format by rotating a row to a column.
Unpivot: Does the opposite of a pivot—it takes data in columns and rotates it into rows.
Look up: Retrieves the values of columns in a table based on a lookup of data from a different table.
*Cleanse: Used to parse, format, correct, and generate commonly used master data related to people and companies, such as names, emails, and other related fields.
GeoCode: Allows you to add geographical information to your data.
Table Comparison: Allows the comparison of two tables with the generation of rows marking the differences, such as INSERT, UPDATE, or DELETE.
Map Operation: Allows you to decide what happens with records that match records in a target; for example, deciding to INSERT a new row as opposed to what would normally be an update of an existing row.
History Preservation: Allows the identification of specific columns that are used to determine if a new row is generated in a target or an existing row is overwritten instead.
Now, it’s time to assemble the flowgraph. Simply drag and drop the transformation nodes from the Palette (on the right of Figure 13) to the container. In this example I dragged and dropped a data source, a filter, a cleanse, and, finally, a data sink (template table). What you don’t see (and is hard to show visually) is that once I dropped the transformations into the container area, I connected the outputs from the lead node (on the left of the figure) to the inputs for the node that follow. This is done by hovering over the leading node (on the left) and waiting for a connector icon to appear, and then dragging the connector icon to the target’s input (on the right).

Figure 13
Connect the transformation nodes
Once you have placed and connected the transformation nodes, you then need to instantiate them with real data and real settings for your business purpose. In this case, I first select the DATA node and then assign it the virtual KNA1 table I created previously.
The basics are shown in Figure 14, using the ERO_KNA1 virtual table (which is already selected using the icon—boxed in red—in Figure 14). Although the Realtime check box is in this case unticked, it is important to mention this option. If you would like this flowgraph to perform real-time replication, then in addition to the Realtime option being set at the container level (Figures 5 and 13), you must also set it in the properties of the Data Source in the screen in Figure 14.

Figure 14
The Data Source node properties
The next node is the Filter. The filter expression, shown in Figure 15, eliminates from the output of the filter any records except those with language (SPRAS) = English (E). In addition, the mappings properties of this filter are used in my example.

Figure 15
The row filter on the General tab of the Filter node
The Mappings tab of the filter transformation allows you to remove columns from the filter output. In this case, I removed many fields (columns) from table KNA1 by selecting them on the target side of the Mappings screen and then by clicking the Remove button (Figure 16).
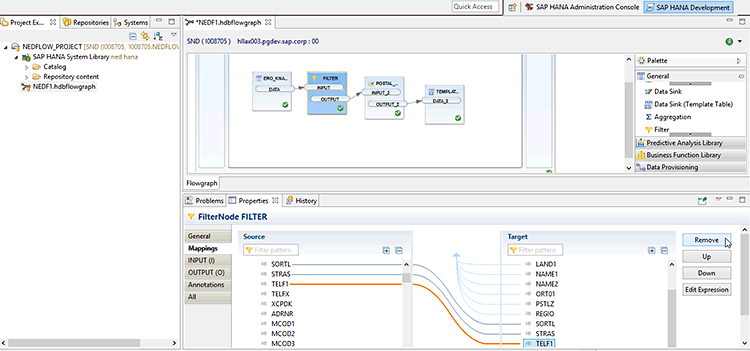
Figure 16
Remove rows from the output (target) of the filter transformation
The next step in my example it to cleanse the data. I want to use the city, state, ZIP Code, and street address as inputs to the logic engine of SAP HANA EIM and let it determine and output the country. I also want to use the NAME1 field as input to derive and output the most likely gender of the customer.
To do this, all the required settings are on the General tab of the cleanse transformation on the input sub-tab. First, I expanded the address section and then the street address sub-section. For each field, I need to tell the cleanse transformation what my data set calls the field.
For example, I had to expand the street address node in the cleanse transformation to find the field City. Then I had to map the cleanse transformation field called City to what in my dataset is called, ORT01. I did the same for region—I told the cleanse transformation that what it calls region is what my data calls REGIO, and what it calls Postal Code is PSTLZ in my datatset. In addition, the cleanse transformation has the ability to figure out what some fields might contain automatically. I did this by mapping the cleanse field called Freeform to my dataset’s STRAS field. That takes care of feeding the cleanse transformation the data it needs to determine the country.
I also wanted it to derive the most likely gender from the person’s name, just to show off another cool feature built in the cleanse transform. In this case I expanded the cleanse transformation’s field list to find the First Name field. I then mapped it to what my dataset calls it (e.g., NAME1). Rather than show all these mappings, Figure 17 shows the Input Field subtab expanded to the First Name field and how I mapped it to NAME1. The settings for the previous Address fields are done the same way.

Figure 17
Output tab of the cleanse transformation
Figures 18 and 19 show the Output Fields subtab of the General tab on the cleanse transformation. Remember, my goal was to get the country of the address and the gender of the person’s name. Figure 18 shows the fields that I want to output to accomplish the first part of this goal, namely the country and the country’s technical code. I set the Enabled column next to the Country Code, Country, and Postcode rows to True to have the cleanse transform output these fields.
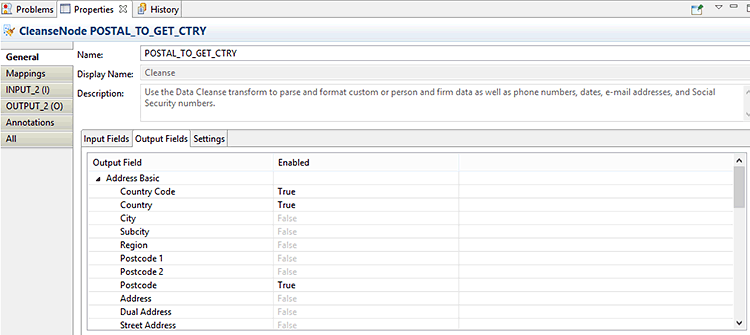
Figure 18
Enable the country output from the cleanse transformation

Figure 19
Enable the predicted gender output from the cleanse transformation
To complete the second part of my goal (e.g., getting the predicted gender based on the first name), I set the cleanse transformation’s Gender row (output) to True in the Enabled column (Figure 19) in the same way as the fields in Figure 18 were enabled.
Now that I have the output from the cleanse transformation, I am almost finished. The only setting that is still required is on the Data Sink (template table) transformation. I choose the schema (XXXXX) and the table name to be generated in this schema (EN Speaking With Country), as shown in Figure 20.
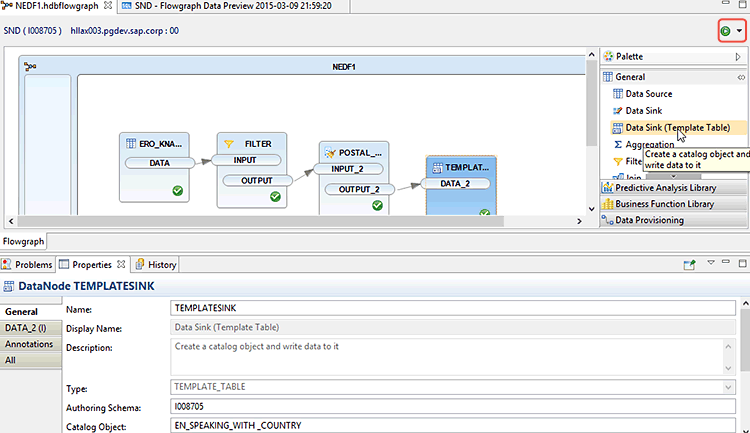
Figure 20
Properties of the schema and table name for output
Once you’ve made your entries, click the activate icon to activate the flowgraph. Now the new SAP HANA EIM flowgraph is ready to execute. In the SQL editor, click the execute icon to execute the new flowgraph. You can verify the result in table EN_SPEAKING_WITH_COUNTRY, as shown in Figure 21. Take note of the generated country fields and the gender. You can display these by using the data Preview option on the context menu of the table in the I008705 schema.
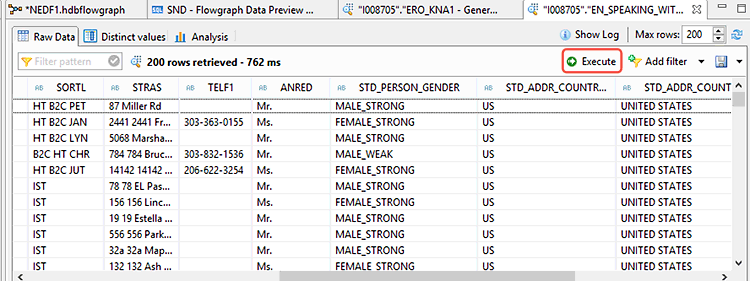
Figure 21
The new SAP HANA EIM results output complete with country and the predicted gender
Ned Falk
Ned Falk is a senior education consultant at SAP. In prior positions, he implemented many ERP solutions, including SAP R/3. While at SAP, he initially focused on logistics. Now he focuses on SAP HANA, SAP BW (formerly SAP NetWeaver BW), SAP CRM, and the integration of SAP BW and SAP BusinessObjects tools. You can meet him in person when he teaches SAP HANA, SAP BW, or SAP CRM classes from the Atlanta SAP office, or in a virtual training class over the web. If you need an SAP education plan for SAP HANA, SAP BW, BusinessObjects, or SAP CRM, you may contact Ned via email.
You may contact the author at ned.falk@sap.com.
If you have comments about this article or publication, or would like to submit an article idea, please contact the editor.