SAP Professional Journal
See how to implement SAPUI5 to provide your users with interactivity and the ability to analyze data when they are on their smartphones or tablets.
Key Concept
SAPUI5 is a user interface (UI) technology with features and APIs that allow you to build lightweight and responsive Web and mobile applications. It is open and flexible and can easily integrate with third-party libraries. Having a basic understanding of HTML5 and JavaScript is sufficient for beginning to use SAPUI5. You can download the development kit for SAPUI5 from here: https://scn.sap.com/community/developer-center/front-end.
The framework allows you to:
- Generate the required UI dynamically based on user inputs
- Define dynamic formulas on the screen as done on spreadsheets
- Execute a dynamic formula at a browser client
- Simulate ad-hoc formulas
- Make the application work on PCs or laptops as well as mobile devices with all the form factors, look and feel, and navigation patterns
- Make the application work on any operating system with any browser
Typically Web-based application execution is a series of HTML pages sent from the server in a request–response cycle initiated by the user from a browser. These traditional Web enterprise applications built as a series of HTML pages fail to fulfill requirements for mobile devices because they do not accommodate information on the available real estate or have a mobile look and feel.
SAPUI5, however, is suited to PCs and laptops as well as mobile devices. It renders Web pages and helps developers quickly build applications with Model-View-Controller (MVC) patterns and easy integration with back-end SAP and non-SAP systems. This application consists of a single HTML page without the need for loading of further HTML pages through the request–response cycles. The whole action is on one page. The framework offers the flexibility to extend or generate new UI sets per application requirements. It is compliant with HTML5 standards and allows you to use JQuery and JavaScript libraries. We walk you through the development steps to create a Web-based tool that you can integrate with any application.
Getting Started
Consider a sample business scenario in which the business user can forecast results (e.g., PROFIT).
For this the user might need knowledge of the current market conditions and various certain and uncertain business elements. Possible evaluation approaches could be:
- Quickly apply simple arithmetic calculation on business elements
- Write complex business formulas that can consist of business elements such as demand or variable cost
- Apply well-proven forecast simulation techniques such as Monte Carlo simulation
Based on the above scenario, the development approach consists of two phases. The first phase consists of business element creation, formula generation, and evaluation. The sample business scenario talks about forecasting results of any input business formula that may involve certain and uncertain elements. In the first phase of development you showcase how the business input elements are developed and used for calculating. In the second phase you enhance the design to simulate the results of a business formula. To follow along with the walkthrough, you need:
- Previous exposure to HTML
- Basic understanding of JavaScript fundamentals
- Preliminary working knowledge of SAPUI5 MVC pattern mobile application
Phase 1. Design the Business Element Calculation Feature
In this phase, you design the application to allow the user to add business elements with values and use them for basic arithmetic calculations. We’re keeping the design simple with a responsive split-screen approach that works for tablets as well as smartphones. Figures 1 and 2 show typical screen design layouts.

Figure 1
Screen layout for tablet

Figure 2
Screen layout for smart phones
The split screen has two views. The left side allows the user to input the business element and its values. The user is allowed to enter the business element name and values to each of the elements using the + icon located on the header. Users can freeze the list of business elements using the GENERATE FORMULA button.
The top of the right side is used to construct the business formula. To construct the formula expression users can enter arithmetic operators using the keyboard and click the business element on the left to enter the element name. The expression is evaluated for profit by clicking the EVALUATE button. The result is displayed below the formula as seen in Figures 1 and 2. Errors and warnings raised during the formula expression evaluation are displayed below the formula. The rest of the area of the right side is reserved for graphical display of the evaluated business formula.
Further, take into account essential design aspects such as:
- Use standard business or arithmetic value elements such as random or square root
- Validate input entries for numeric values
- Allow users to delete or modify business elements from the list
- Clear the formula expression from the right side text area
- Validate formula expression and display related messages
Table 1 lists the files required to design the complete application.

Table 1
Files required to design the complete application
Figure 3 shows the overall application design with technical components.

Figure 3
Application design - technical components
Following is more detail about each of the components.
1. Index.html: This file launches applications in a browser. It has three main parts:
- Business Element Collection Model that holds all business elements that the user creates and adds in the LIST UI of the Input Master View
- Formula Expression Model holds the formula expression that the user constructs and evaluates in the Formula expression area UI of the Formula Detail View
- JavaScript view app that launches the application in the body of the HTML document
A related code snippet is shown in Figure 4 with the business element collection model, formula expression model, and JavaScript view app.

Figure 4
Code snippet of index.html
2. Application View: This is a JavaScript view. It consists of JavaScript files for the view and controller. The view is rendered in the body part of the HTML file at the time of application execution. It renders a shell UI in the body that consists of a Split Application UI (a UI that consists of master and detail pages). The Master Page of the Split Application UI is rendered by the InputMaster view. The FormulaDetail view renders the detail page of the Split Application UI.
Figure 5 shows the design and construction of the UI components within the App View along with the code snippet of the App View file. The graphic on the right explains how the UI components are structured and placed in this App View. This is shown in the code snippet on the left. The Shell is the outermost UI component within which lies the Split Application UI, which further consists of the Master Page and Detail Page. The Master Page renders the InputMaster view whereas the Detail Page renders the FormulaDetail view.
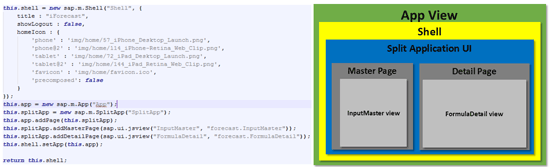
Figure 5
Application view - technical component design
For the current application functionalities you do not need to write code for the Controller part of the view and therefore it is blank. At this point, there is no data processing or screen navigation and therefore the Controller is not used.
3. The InputMaster view is the JavaScript view. It consists of JavaScript files for the view and controller. As shown in Figure 3, this view consists of the List UI for business elements that the user adds. The List UI binds to the business element collection model. The view also allows you to delete business elements in the List UI, freeze entries, and construct business formulas. You click the Business Element list to make business elements appear in the formula expression string.
The series of code snippets of the view in the next section shows how the aspects described above are addressed including the List UI for business elements, binding this list to the element collection model, deleting business elements, freezing enteries, and constructing business elements.
Business Element List Declaration
The List UI component that is rendered in the InputMaster view is a two-column base, which means it has two columns, one to show the business element name and the second to enter values of the business element name. Each cell of a column is declared based on need. Here we use a Text component and Input Text component. Figure 6 shows code lines that create the List UI with a column-based display.

Figure 6
Business element list UI declaration
Display and Edit Mode of List UI
For business element entry, the List UI should be in edit mode. However, when a user is constructing a business formula, the List UI must be in display mode. For this reason you need two templates. The edit template must validate all busines element names with no space character. The code snippets in Figures 7 and 8 show the definition of two templates for edit and display, respectively.

Figure 7
List UI edit mode template definition

Figure 8
List UI display mode template definition
Binding the Business Element Collection Model to List UI
The commands in Figure 9 bind the model to the List UI. The code shows the model declared earlier in Figure 4 and makes it available globally for all application components in index.html.
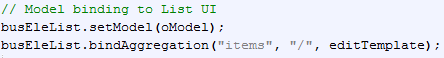
Figure 9
Model binding to List UI
Actions Definitions for the List Delete, Select, Add, and Freeze Operations
The action delete triggers an event that removes an entry from the business element display List UI as well as from the business element collection model. My approach is to delete the item from the model and reinforce the List UI binding. Figure 10 shows the delete action code.

Figure 10
Delete action definition
Once all the business elements are entered along with corresponding values in edit mode, click the Generate Formula button and the List UI changes to display mode. The action Select is triggered as the user clicks a List UI item. This action prints the selected business element name (present on the List UI item) in the formula expression text area UI in the FormulaDetail view. Since the formula expression model is globally available (declared in index.html) and bound to the formula expression text area UI of FormulaDetail view, a simple update in the formula expression model reflects the changes. This can be achieved using the code in Figure 11.

Figure 11
Select action definition
The action add triggers an event as a user clicks the + icon located on the header. The addition of a business element is technically pushing one blank entry into the business element collection model. The update binding of the model reflects the new entry on the List UI component as shown in Figure 12.
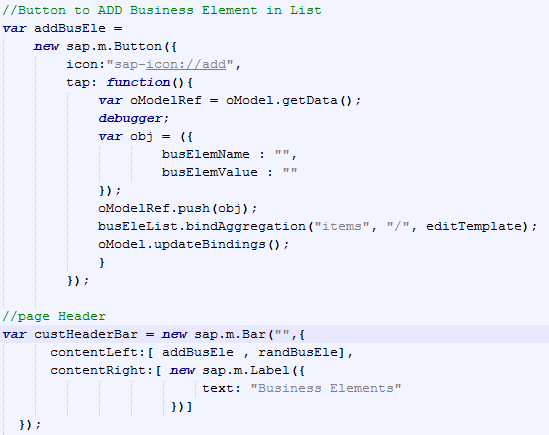
Figure 12
Button to add a new business element in List UI
The footer bar Generate Formula button of the view triggers an event that changes the List UI to display mode. The user can now construct a business formula as shown in Figure 13.

Figure 13
Code for footer bar with button to freeze data entry in List UI
Page Definition
The view controller returns the page that consists of the header, footer, and List UI. Figure 14 shows the code.
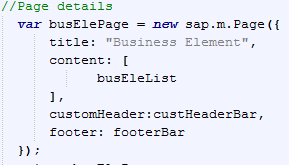
Figure 14
Page details
1. FormulaDetail View
The FormulaDetail view is a JavaScript view that consists of JavaScript files for view and controller. As shown in Figure 3 this view consists of the formula expression area UI to construct a business formula using arithmetic operators and business elements from the InputMaster view. The output of the evaluation of the business formula is displayed in the result area UI. It also displays error or warning messages generated as a result of the business formula evaluation. The formula expression area UI is a text area that binds to the formula expression model (Figure 15).

Figure 15
Definition and binding of UI
The view returns the page with the page header and page footer along with the formula expression area UI and result area UI. Figure 16 shows the details.

Figure 16
Page definition
The page header is the bar UI that shows the header label and the button that triggers events and processes the business formula expression (Figure 17).

Figure 17
Page header definition
The most important part of the page header code is the evaluateFN function shown in Figure 16 that evaluates the business formula expression. It typically is a character string consisting of business elements, arithmetic operators, and necessary brackets. To evaluate a character string that consists of mathematical expressions you could use the JavaScript eval() function. However, improper use of eval() opens up your code for injection attacks. Many other alternatives developed using JavaScript are available to provide evaluation functionalities. For this application, we selected the MathJS JavaScript library. It features a flexible expression parser and offers an integrated solution to work with real and complex numbers, units, and matrices.
You need MathJSJavaScript library (javascript file) included as part of application to initiate the math object at the start of application. For this prerequisite, I have modified index.html as shown in Figure 18.

Figure 18
MathJS initiation in index.html
As soon as the math object instance is created as part of the application execution, you can parse the string using the parse() function as a first step. Then you can evaluate the parsed string with the eval() function. This two-step process can be done in one single line of code as shown in Figure 19.

Figure 19
Evaluation funciton code snippet
However, the parse operation is required to validate the string components (for example, business element names) existence, apart from the mathematical operators. For this reason, the parse() function also provides a facility to use a scope variable object. It stores all the variable names and values that are part of the mathematical expression string. In our example you need to build a scope variable object with all the business elements and their respective values from the business element collection model. Further, all errors should be displayed on the result area UI.
Application Execution
Although the functionality of the business element calculation feature can be built easily there are many more design aspects that a developer can implement to suit various business needs. The execution of the application is shown in Figure 20.
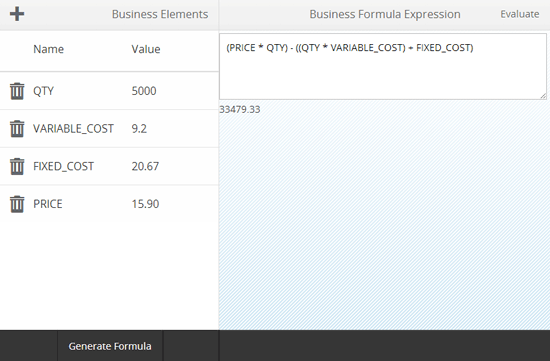
Figure 20
Application execution display
Application design up to this stage has focused on arithmetic operations between business elements to get an evaluation result. The next section explains how to enhance it so that you can evaluate complex business formulas.
Phase 2. Advanced Simulation Program
Many times business users’ needs go beyond the evaluation of a business formula. For example, they might want to forecast sales figures or see the expected profit of a sale using probability analysis and simulation techniques. Let’s enhance the existing application further to meet those needs. We use the following example as the base for the application design.
Business example: A company plans to introduce product A and would like to know the probable distribution of profit and loss under perfect market conditions. Further, the company is interested in knowing the business elements that contribute to success or failure and what the safe value ranges are to minimize risk. Figure 21 shows the business elements that are involved and the correlation among them.
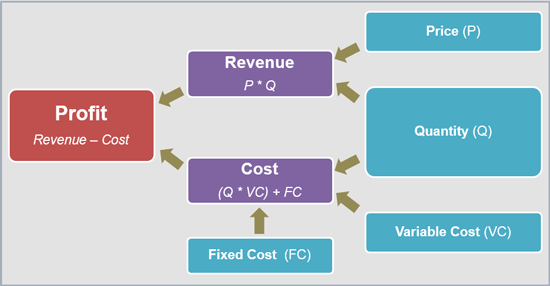
Figure 21
Business elements and their relationship
As shown in Figure 21, the profit is calculated based on revenue generated minus the cost of the component. In the business formula there are three uncertain business elements: Quantity, price, and variable cost. The uncertain business element limits are:
- Quantity range: Minimum 500 and maximum 12,000
- Price range: Minimum $4 and maximum $13
- Variable cost range: Minimum $3 and maximum $9
Note
A real-world business scenario would be more complex than the above example. For the sake of simplicity, we chose a primary business element.
In the business example, the user needs to simulate the business formula with fixed and uncertain values. We are using the Monte Carlo simulation. It enables you to model simulations that present uncertainty and play them out thousands of times. The generation of the pseudo-random number R that is distributed uniformly over interval 0 < R < 1 is at the heart of any Monte Carlo simulation. You need to generate many samples and get the average (or any other statistics) as the result. For a high-level understanding of the simulation process see Figure 22.
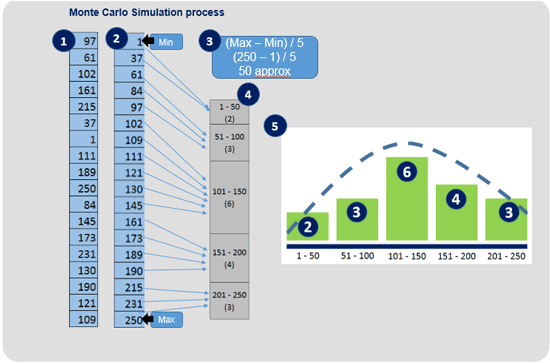
Figure 22
Monte Carlo simulation process
As shown Figure 22 the process steps are as follows:
- Business formula (containing certain and uncertain business elements) evaluation done a fixed number of times. Every evaluation result is collected in a collection array.
- Collection array sorted in ascending or descending order.
- Calculate the value range by maximum value less minimum value. Make an equal number of value packets. Generally value packets can be in the range of 1–100 that are used as X-axis units for the histogram frequency distribution chart as shown in Figure 22.
- Each value packet is suitable to store a count of evaluation result values that fit within a packet range. For example, packet (151–200) stores count four.
- A frequency distribution chart is the final result. A number of packets marked on the X-axis and related bar represent the number of counts plotted on the Y-axis. Generally a bar chart of a distribution model shows a bell curve (as shown by dotted line). The peak of the bell curve indicates the probability of result values for a given business formula with certain and uncertain business elements.
Although Figure 22 shows packet size 5 you can design it to be any number based on your requirements. Business formula evaluations are generally done thousands of times to get a more accurate bell curve. To make the application suitable for the simulation process, you need the following enhancements in your application design:
- Random generator, which is used to derive uncertain business elements.
- Collector array to store evaluation results of every simulation of the business formula.
- Frequency distribution array to store the count of occurrences within defined packets.
- Chart the UI component, an SAPUI5 component to display charts, to plot frequency distribution counts against packets.
Enhancements discussed here need to be incorporated in respective application files, primarily index.html, InputMaster view, and FormulaDetail view:
1. Random generator: We implement a UI button on the header of the InputMaster view. Clicking it triggers an event that introduces a random (RAND) element into the existing List UI as shown in Figure 23. Figure 24 shows the related code.
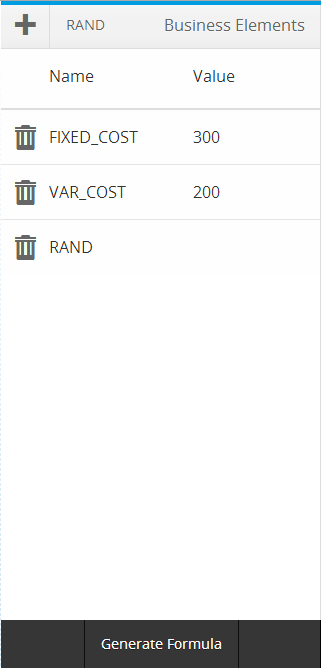
Figure 23
RAND button added to header on InputMaster view

Figure 24
Random functionality into InputMaster view
You use a random generated number only at the time of the evaluation of the business formula. Therefore the business element collection model only stores RAND as a business element name and not the corresponding random value.
2. The collector array stores evaluation results of every simulation of the business formula.
3. A frequency distribution array stores the count of occurrences within defined packets.
4. A chart UI component plots frequency distribution counts against the packets discussed earlier.
The enhancements 2,3 and 4 explained above are designed in the FormulaDetail view within the JavaScript function evaluateFN. The detailed definition of evaluateFN is shown in Figure 25.

Figure 25
Evaluate function enhancement in FormulaDetail view
As shown in Figure 25, jQuery.each control loop fills business elements and their respective values in the javascript object variable scope. The try….catch statements calls another JavaScript function collectionFN to perform a number of simulations of the business formula expression and store them in collection array collectionArr. Details of the JavaScript function collectionFN are shown in Figure 26.

Figure 26
Collection funciton details
As shown in Figure 26 the variable simulationLimit is used for number of simulations. Although its value is set to 1,500, this variable can be declared globally in index.html and can be set to any value. The try….catch statement will collect simulation results in to collectionArr.
After successful simulation rounds the collection array is sorted in ascending order. The code line is defined in evaluateFN after the code line for function collectionFN as shown in Figure 25.
For enhancement 3, function frequencyDistModelFN performs the job of frequency distribution of evaluated values as explained in steps 3 and 4 of Figure 22. The execution output of the function frequencyDistModelFN provides the JSON data structure that you use to plot a frequency distribution curve. The JSON data variable is just above the function evaluateFN.
The JSON structure is designed to store packet range information using the attribute tags min and max. The occurrence attribute stores the number of counts of simulation results that fit into the packet range as explained in Figure 22.
The function frequencyDistModelFN derives the packet size and populates the JSON structure with packet information. All element values of the collection array are verified for packet fitting and respective packet occurrence attributes measure counts in the JSON structure. The simplified code is shown in Figure 27.
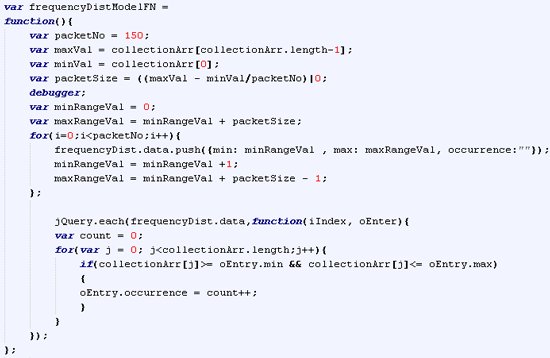
Figure 27
Function to derive packet size and fill JSON structure packet occurrences
Successful execution of function frequencyDistModelFN provides the JSON structure with all packets and occurrences to plot the chart. For enhancement 4, define the column chart and the JSON model to bind. Declare the chart library sap.viz in SAPUI5 bootstrap script and define the chart model in index.html as shown in Figure 28.
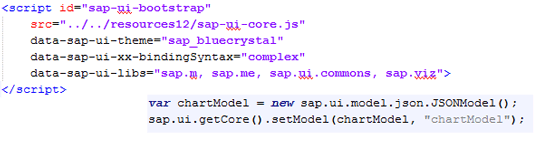
Figuer 28
Inclusion of chart library sap.viz and it intialization
The chart UI with its dataset is defined and bound to the chart model in the FormulaDetail view as shown in Figure 29.

Figure 29
Chart declaration and binding with chart model
If any errors occur during the new code execution for enhancements 2, 3, and 4, they are trapped and displayed in a result area in the UI as per the code line shown in Figure 25.
Enhanced Application Execution
The business example described in Figure 21 was referred to as the base for the enhancement of the application. Figure 30 shows the application execution for the same business example. An uncertain business element such as variable cost can be defined using RAND. You can limit the random range by expression (RAND * <max value>) + <minimum value>. A developer can add other elements such as SQRT (square root), SIN (Sine value), and so on based on need. The beauty of the application is that the user can change the value of any business element and can see it immediately reflected in the bell-curve variation.

Figure 30
Enhanced application execution display
Further Scope
You can extend the scope of use for this functionality in the following ways:
- Use offline capability with database or persistence staging, which might help a user to see historical results as a quick guideline.
- Provide a set of well-defined formulas prepopulated in an application (can be financial, electrical mechanical, or geometric formulas).
- Design and implement more simulation cycles (in millions) based on HTML5 Web worker functions. (Web worker is a JavaScript that runs in background, independent of other user-interface scripts.)
Sandesh Darne
Sandesh Darne is a senior lead for the Consulting ERP Practice at L&T Infotech, India. He leads a group of senior consultants whose primarily focus is on SAP upgrades and SAP usability consulting services. He also directs the SAP NetWeaver Portal and the SAP Center of Excellence, which focuses on excellent practices in organizations. He is certified in SAP NetWeaver Business Warehouse 3.5. He has also worked in the product development department of L&T Infotech where products such as ZoomUP, eALPS, and CodeReview were built and used as accelerators for SAP upgrade projects.
You may contact the author at sandesh.darne@lntinfotech.com.
If you have comments about this article or publication, or would like to submit an article idea, please contact the editor.

Fedorah D'souza
Fedorah D’souza is a senior mobility architect at L&T Infotech, Navi Mumbai, India, with a primary focus on architecting and deploying SAP-integrated mobility solutions for the enterprise. She has participated in several mobility solution implementations and her core experience is with developing responsive applications with front-end technologies such as HTML5, JavaScript, SAPUI5, jQuery, Angular and Bootstrap to containers such as SAP’s Hybrid Web container and Apache Cordova deployed to the SAP Mobile Platform.
If you have comments about this article or publication, or would like to submit an article idea, please contact the editor.