A collaborative process between business and IT stakeholders is the key to a successful dashboard strategy. Learn strategies to improve this collaboration and gain insight into development issues that users can influence.
Key Concept
User experience dictates how an end user perceives value and utility from interacting with a dashboard. Dashboards rely on good user experience design to ensure business users can easily consume and assimilate information.
Dashboards provide an approachable entry point for 80 percent of business users within many organizations who do not typically benefit from business intelligence software. Business and IT stakeholders responsible for maximizing their software investments in BI solutions have powerful technology at their disposal. This article provides basic guidelines to building dashboards with SAP BusinessObjects Dashboards (formerly Xcelsius).
BusinessObjects Dashboards provides a free-form design paradigm, allowing developers to create the optimal experience for consuming information. This free-form design paradigm is a double-edged sword because it provides maximum flexibility to create a wide range of dashboard applications; however, such flexibility requires developers and business consumers to collaborate to ensure business objectives are satisfied. With a sound scoping design process, data connectivity, and simple user experience, BusinessObjects Dashboards can be a very effective tool for a wide range of BI needs.
Scoping and Design
An important aspect of the initial dashboard design process is to reduce layers of abstraction between developers and business users. The collaborative mindset to solve specific business problems requires both technical and business experts to work together. Because dashboards are designed for specific business analysis purposes, business users should help drive decisions to prioritize information output. Separating dashboard developers from business stakeholders can strain a dashboard initiative, increasing the chances for a final working product that misses the mark due to lapses in communication.
The most successful dashboard projects involve business stakeholders who truly understand what dashboard end users need, and experienced development resources who can apply best practices to create a final working product. A dashboard solution will naturally evolve as the adoption increases and end users boost their capacity for more information. The key to ensuring the first iteration of a dashboard is a hit with end users is communication. Dashboard developers should set expectations of what is technically possible while business users prioritize what is most important. With clear-cut roles and responsibilities and a level of cross pollination, your company’s dashboard initiatives will run significantly more smoothly.
Connectivity Concerns
Many dashboard design technologies available in the marketplace require data connectivity to be established before the user experience design can start. In contrast, you can assemble, validate, and modify BusinessObjects Dashboards charts, tables, and navigation controls independent of data connectivity. Many companies often use static Microsoft Excel spreadsheets to stage and prove dashboard designs before connecting to live data. I highly recommended this process, especially for organizations that are new to dashboards. New dashboard initiatives require more revisions, so Excel-based dashboards lead to fast iterations toward a final working product.
Building a dashboard from an Excel spreadsheet that is prepared for live data requires a level of expertise acquired after creating a few successful dashboards. There is a natural learning curve for new BusinessObjects Dashboards developers who are tasked with converting an Excel-based dashboard to a connected version. The benefit of connectivity for end users is increased frequency and volume of information available within a dashboard.
With a business-endorsed dashboard ready for live data, BusinessObjects Dashboards provides a variety of options depending on the data source and version of BusinessObjects you are connecting to. For example, SAP NetWeaver BW customers can take advantage of BI consumer services (BICS), allowing for point and click integration of queries. The upside of this connectivity option is increased performance and inherited use of SAP security for SAP landscapes that are running SAP NetWeaver BW 7.1 or later releases.
BusinessObjects users who desire connectivity can also take advantage of tools such as Query as a Web Service (QaaWS), a utility for configuring Web services against the BusinessObjects semantic layer. The future of the BusinessObjects semantic layer is demonstrated through a brand new dashboard query panel, introduced with the release of BusinessObjects 4.0 (Figure 1). Finally, BusinessObjects Dashboards also provides connectivity options for integrating custom Web services, often used by companies with home-grown Web applications.
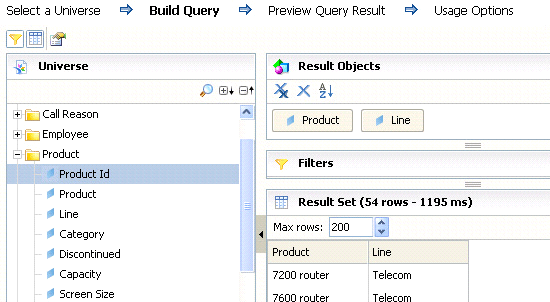
Figure 1
BusinessObjects Dashboards new query panel
A benefit of using BusinessObjects Dashboards in any of these connectivity options is that they can be combined within a single dashboard. Once a company identifies which connectivity options its landscape supports, there is a consistent approach for integration.
User Experience
User experience encapsulates all aspects of the user’s interaction within a dashboard and what information is displayed at given time. BusinessObjects Dashboards requires a high level of attention to layout, workflow, and data retrieval to create the best possible user experience.
Dashboard design borrows layout design principles from Web applications, ensuring end users have a familiar process for navigating information. Most navigation in a dashboard should exist at the top or left-hand side of the page, since this is where end users instinctively gravitate to. BusinessObjects Dashboards includes a variety of visual controls like menus, list boxes, and combo boxes.
The workflow for how dashboard end users consume information should always relay information first prioritized by the business stakeholders, and then streamlined down to a manageable number of components per page. If a dashboard design calls for three charts, the most important one should exist in the upper left corner or center of the page. With a multiview dashboard, the most important performance indicators or supporting analytics should be the first screen. A top-down, left-to-right approach visually prioritizes how a user navigates a page (Figure 2). When business users educate themselves about dashboard design principles, they can accelerate the design process by decreasing iterations on workflow design.

Figure 2
This typical dashboard navigation illustrates the order of importance for screen positions
Data retrieval is typically an aspect of user experience that is not executed well, but highly influential to the adoption of dashboards by business users. Data retrieval is defined as the time that an end user waits for data to appear. Retrieval often requires multiple queries that influence how fast information is retrieved and then presented to end users.
The goal is to optimize the user experience so a user does not get frustrated waiting too long for data. The expectation for dashboard data retrieval is 10 seconds to 15 seconds, a benchmark that all dashboard developers should work toward. BusinessObjects Dashboards provides a great way for dashboards to store data in-memory for runtime manipulation (e.g., filtering or calculations).
Rather than triggering every query during dashboard initialization, the system simply retrieves a subset of the total data required during a single dashboard session. Subsequent queries can be triggered as a user navigates within the dashboard. Each query should return less than a few thousand rows of data at a time to ensure appropriate utilization of in-memory logic without overloading the dashboard. This careful balance of client-side processing and multiple queries allows a business user to consume large volumes of data in a controlled, scalable interface.
Whether you are approaching dashboards for the first time or expanding on a current initiative, there is always room for improving your dashboard execution. One of the best aspects of using BusinessObjects Dashboards is the wealth of knowledge freely distributed through long-standing development and user communities. I am happy to be a part of this community and look forward to sharing more experiences and tips for success so you can increase your organization’s dashboard adoption.
Ryan Goodman
Ryan Goodman is founder and CEO of Centigon Solutions, an author, and an expert in business intelligence dashboards. As a previous technical evangelist and sales consultant at SAP BusinessObjects, he has implemented hundreds of successful SAP BusinessObjects Dashboards and Xcelsius projects spanning more than seven years. You may read his blog at https://ryangoodman.net/blog.
You may contact the author at ryan@centigonsolutions.com.
If you have comments about this article or publication, or would like to submit an article idea, please contact the editor.