Find out about a standard tool, QuickViewer, that allows you to create reports without programming.
Key Concept
QuickViewer allows you to define your own data queries based on table joins and logical databases. It is a useful tool when you have to perform a fast, unplanned analysis of non-standard data to solve an urgent issue. QuickViewer requires that you understand which tables you need for an analysis and what values are represented in the table fields.
Client: Can you provide me a list of subtotals, in pricing and sales order type, for
this list of customers and materials for 2006?
Me: Well, yes and no. It is not a standard report. It involves two different tables:
VBAK for the sales order type and VBAP for the pricing procedure details. I can try to
combine them in Microsoft Excel or Access, but it will take some time. Could you come back at the end of the week? If you
need this type of analysis often, you should enter a change request for a new report. Is there a budget for this analysis?
Client: Hey, this is urgent! Why can’t I create a simple list? Our old system
…
Users and consultants often run into this issue — you always need the report that the ABAP
programmers did not build. After go-live, you would like to have a list that is not available with existing reports. The
ABAP programmer has left and you are faced with the uphill struggle of having a change request approved. This occurs more
frequently if your R/3 or mySAP ERP Central Component (ECC) system includes custom tables that are outside normal
reporting.
Many of us have wished for an uncomplicated method that allows us to perform this analysis. With R/3
Release 4.6, SAP has complied. A functionality called QuickViewer lets you define reports without programming or a long
course in Report Painter. It hides in the System>Services menu path. I discovered it by accident.
After you understand the various data sources involved, you’ll find that this is a good tool to know. Of course it
is not a solution to all problems. The tables and reports you create are straightforward with SAP List Viewer (ALV)
functionality. You cannot add additional logic as you could if you specified a report for ABAP programming.
I’ll show you the basics of QuickViewer in three steps, using an example of logical database
VAV, which combines the main sales order-related tables in the Sales and Distribution (SD) module. Then
I’ll give you a tip about using QuickViewer to join information from two different tables — no customizing
required.
The Steps
My first example is based on a simple question. A sales manager wants to analyze a subtotal in the pricing
procedure for a combination of customers, materials, and sales order types. Of course, the sales manager should have
thought about that when the programmers configured Profitability Analysis (CO-PA), but it’s too late now. Normally
it would take significant time and work to provide this analysis. However, once you understand QuickViewer you should be
able to do this in a couple of hours. To find QuickViewer, use menu path
System>Services>QuickViewer or transaction code SQVI. Click on the
Create button. This takes you to the Create QuickView screen (Figures 1
and 2).

Figure 1
Click on the Create button in the QuickViewer: Initial Screen
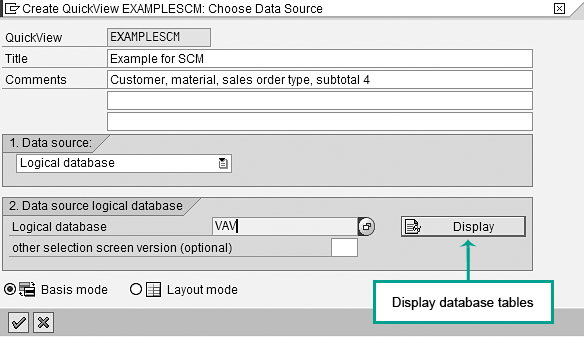
Figure 2
Create QuickView screen
Step 1. Give your QuickView a name and choose your data source. For example, I named my
QuickView EXAMPLESCM and selected the Logical database as the data source. When finished,
press Enter.
In QuickViewer, you have the following choices for the data source:
- Single table: Using a table allows you to create and share a report on a single
table.
- Table join: A set of two or more tables that you create
- SAP Query InfoSet: Combinations of tables that are used by queries in
the system. They allow reuse of information explored by existing queries.
- Logical database: A preconfigured set of tables that provides a view
of several database tables. You can choose from a drop-down list of more than 180 logical databases defined in SAP. You
use them in ABAP programs to retrieve data and provide it to application programs. Useful logical databases are
AAV (sales order-related tables), ARV and VFV (billing document-related
tables), and VLV (delivery-related tables).
In this example I used logical database VAV. This database combines the main sales order-
related tables in the SD module (Figure 3).
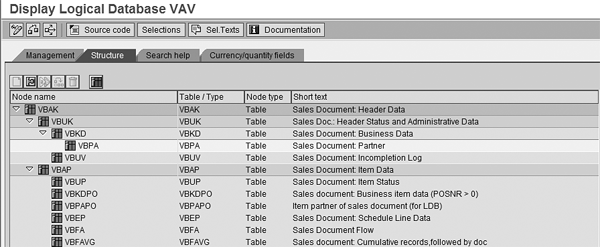
Figure 3
Logical database VAV combines major SD tables for analysis and reporting
Tip!
If you are not sure what is hidden in a database, click on the Display button in Figure 2 to see all of the tables the database contains, as shown in Figure 3.
Step 2. Select fields. After you press Enter, the main screen for QuickViewer
appears (Figure 4). Now you select the relevant fields for your report. Checking items in the
Selection Fields column narrows down the report results. Checking items in the List
fields column includes the items in the report. In the List fld. select. tab on
the right side of the screen, select the values you need in the Available fields column and move them to
the Fields in list column by clicking on the left arrow.
Note
Help is available in the main QuickViewer screen. Click on the links at the bottom of the page in the Help topics window to open the relevant documentation.
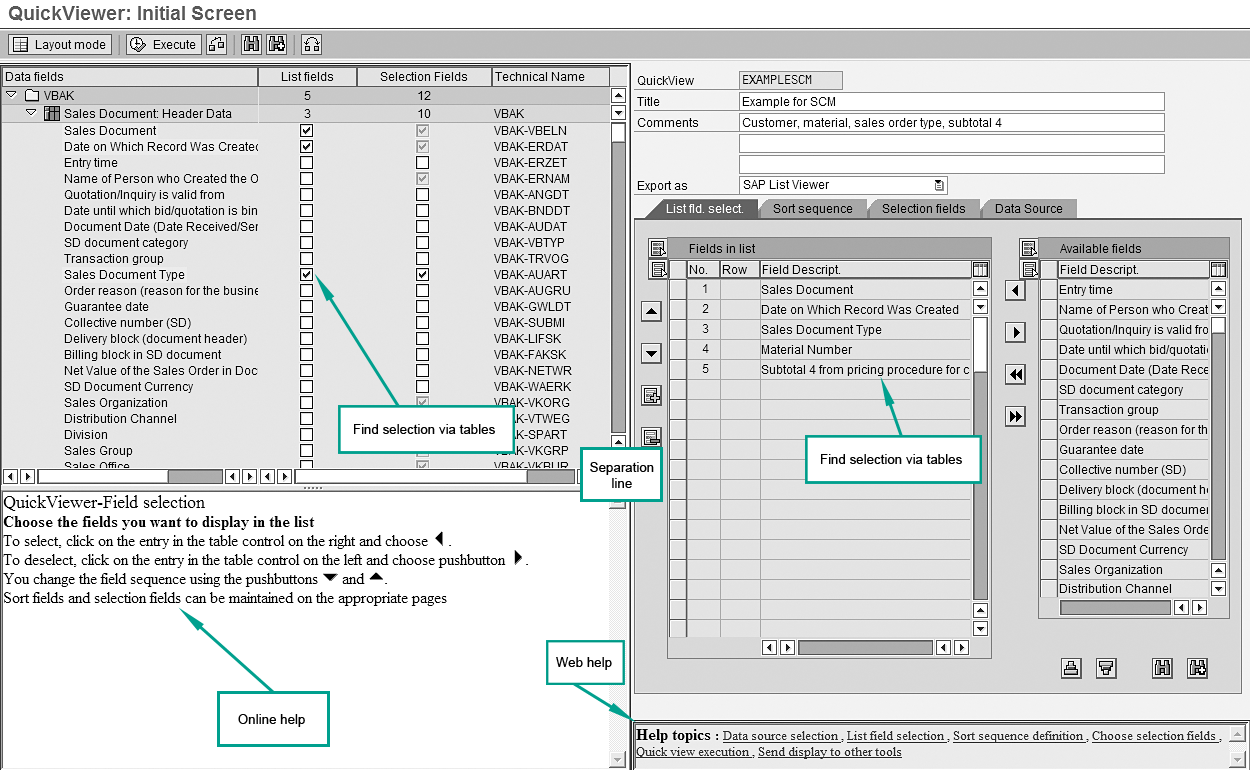
Figure 4
Select the fields for your report
Another way to select fields is to use the left side of the screen, open the table, and
select fields you need by dragging the separation line to the right. I prefer this method because it’s clear from
what table the field value is coming. For my example, I chose the selection fields sold to, sales order document type,
material number, and subtotal 4 from the Data Fields on the left side of Figure 4. SAP provides the
logical database key fields as standard.
Before you execute a test run of your report, select the type of output you want. In Figure 4, click on the
drop-down menu in the Export as field. You can choose all standard SAP formats, plus Excel and Word
(Figure 5). I chose Microsoft Excel for my example.
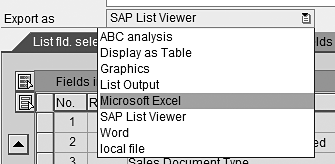
Figure 5
Select the type of output for your report
Step 3. Execute the report. Click on the Execute button in
Figure 4. The selection screen for your report appears (Figure 6). I chose Excel for the output format in
step 2, so the system defaults to Spreadsheet in the Output format section in Figure 6.
If I wanted, I could choose to display the data in another format.
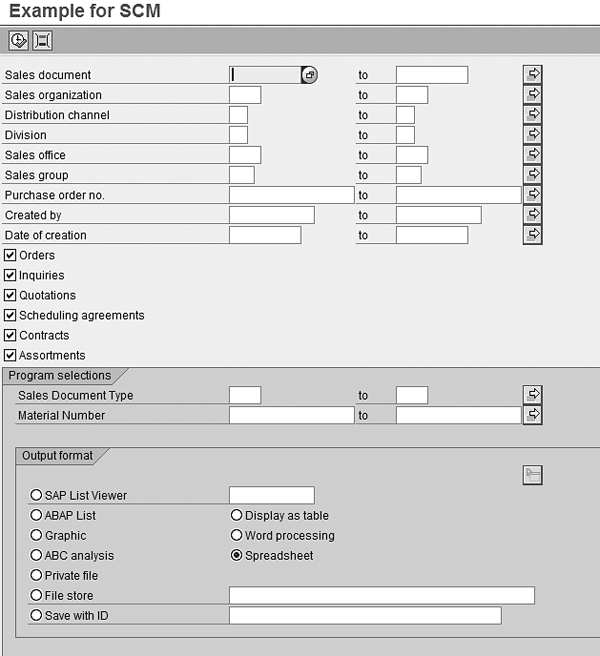
Figure 6
Report selection screen
Enter the selection data for your report and click on the Execute button (Figure 5). The
report shown in Figure 7 appears. If the report output is not exactly what you want, you can go back
into QuickViewer and change some details. You can adjust the colors in the layout mode. When you are satisfied, you can
save the report output for later use.
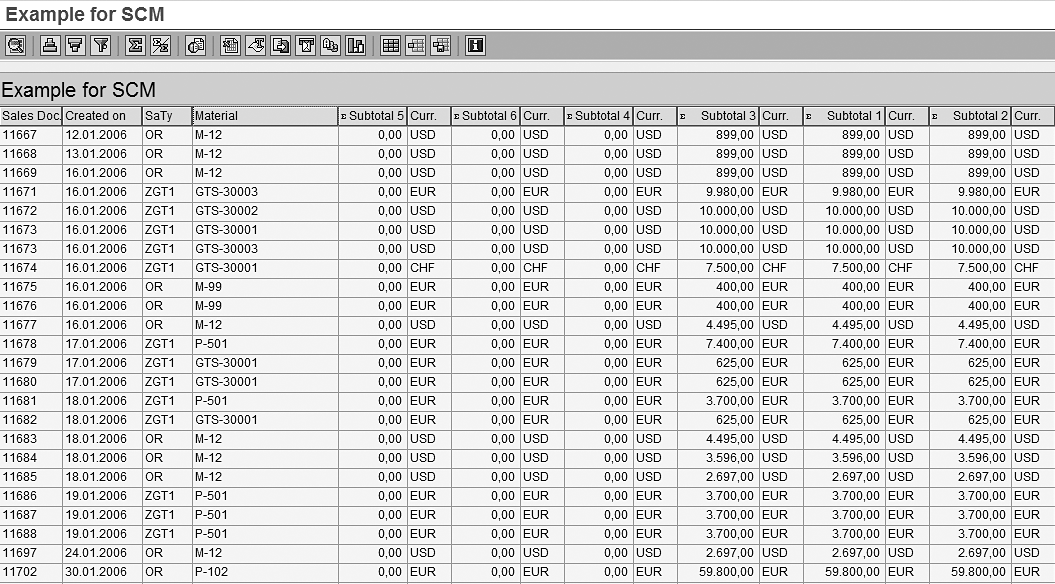
Figure 7
The report output
Creating this should not take very long for consultants or experienced support professionals who know which
table fields are needed. After you become used to QuickViewer it should be a matter of hours to create an
analysis.
QuickViewer with Table Joins
As I explained earlier, logical databases are not the only source for a QuickViewer. You can also work
with tables. The main steps are the same; only the data source is different. Use this approach when you want to combine
data from two or more tables. For example, I recently needed a list of IDocs with error status 51 (IDoc
could not be processed) sorted by error message. Table EDIDS stores the error message number; table
EDIDC stores the IDoc number and error status.
Use menu path System>Services>QuickViewer or transaction code
SQVI. Click on the Create button to return to the Create QuickView
screen. This time, select Table join as a Data source (Figure
8) and press Enter. Next, you need to provide the tables you want to analyze. After you press Enter, the system
displays an empty screen on which you can enter the tables by selecting Edit>Insert table
(Figure 9).
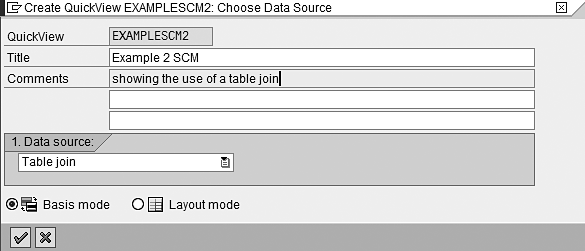
Figure 8
Select Table join as a data source
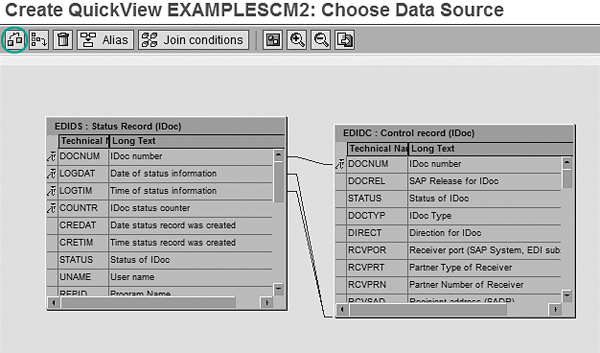
Figure 9
The table join that results when you insert tables EDIDS and EDIDC
For my selection and report I need IDoc number (EDIDC-DOCNUM), IDoc status (EDIDC-
STATUS), and error message number (EDIDS-STAMNO). An example of this is IDoc 654321, error
status 51, and message, “Delivery could not be processed due to insufficient stock.” Inserting tables
EDIDC and EDIDS in results in a graphical display of joined tables (Figure 9). This is
the basis of your report. The system links the tables automatically. However, if you want to remove a link, click on it
and select Remove join condition from the pop-up screen that appears. In general, this is not necessary,
as the links are standard SAP. However, you might have a special case in which you want to use a different logic to link
one or more tables. If the link is not correct, the system shows an error message.
Clicking on the green arrow icon takes you back to the main screen, where you select the fields to include
in your report and define the selection screen as you did in the first example. You might want to click on the check icon
circled in Figure 9 first to see if any inconsistencies exist in the links between tables. These can occur if you change
the links between tables and make a logical mistake. After you have mastered these two examples, working with the other
two available data sources — single tables and SAP Query InfoSets — should pose no problems.
QuickViewer Tips
Unskilled users can create resource- consuming queries, so QuickViewer is primarily for functional
experts, super users, and support functions. However, if you think your report is worth the attention of others, you can
publicize it as a query. To do this, follow menu path Tools>ABAP workbench>Utilities>SAP
Query>Queries. On this screen, select the user group you want to read your report by going to
Edit>Other user group. Select Query>convert QuickView and a screen pops up to
convert your QuickView into a query that all members of your user group can read. You have to enter a name for your query
and a name for the InfoSet linked to it. Both are free format.
If you want to use your QuickView as a report or transaction in SAP, you can do your programmer a favor.
Run transaction SE38 and clear the input field. Then, run QuickViewer and execute transaction
SE38 again. In the input field, you now see the program name that represents your QuickView. Give this
information to the programmer, who can copy the code into a report and add a transaction code, menu path, and
authorization object, if required.
Dr. Stef G.M. Cornelissen
Dr. Stef G.M. Cornelissen, MBA, is an experienced international SAP business consultant from the Netherlands with certifications in FI, CO, and SD. He took part in important international projects involving the large Dutch multinationals. Before specializing in SAP, he worked as a management consultant and was a senior advisor to the Board of Directors of the University of Nijmegen. Stef's academic background is in business administration, economics, and organizational science. He is the owner of Bowstring BV and principal partner at Sperry Associates.
You may contact the author at info@bowstring.nl.
If you have comments about this article or publication, or would like to submit an article idea, please contact the editor.


