Adapting your BI data warehouse environment to use a business intelligence design-centric development process allows you to incorporate best practices as a standard part of data modeling and query design. Learn about the four phases in a design-centric development implementation that you can apply to your SAP NetWeaver BI system and the steps required for each phase.
Key Concept
Design-centric BI development methodology stresses the importance of data modeling on paper prior to performing any technical changes within the data warehouse. It also advocates a holistic approach to BI back-end development in which all the data components that are important to the resulting queries are considered from the beginning of the process and incorporated into the final solution.
As business users learn to use the analytical tools that are now available to them, the requirements for availability of information within a data warehouse increase exponentially. Faced with the complexity of the data warehouse architecture, BI teams are pressured to deliver more InfoProviders in a shorter time frame.
The recent agile development revolution in the programming realm has allowed many IT shops to set new standards for acceptable development efficiency. This methodology focuses on dividing and delivering solutions in smaller, more manageable chunks of work while keeping a continuous feedback loop with the end user throughout the development process.
However, when it comes to back-end development within a data warehouse — including the modeling of InfoProviders and the extraction, transformation, and loading (ETL) process — design-centric development methodology is more efficient and effective.
This methodology allows you to deliver more InfoProviders to the end user with less back-end development effort and re- work, which minimizes costly last-minute changes. Design-centric techniques ensure the use of all known best practices throughout the BI development process and provide a standardized framework for BI analysts to follow when rolling out new analytical areas.
When it comes to SAP NetWeaver BI, few businesses are lucky enough to have end users who are capable of understanding the back-end components of a data warehouse. More often than not, you do not need to physically demonstrate anything to business users until the first version of the actual query is built. That is why it is impractical to use the agile development techniques to interact with end users and communicate about the progress of a particular analytical model. This is where the BI design-centric development process can help. I’ll define the milestones for such a project and then go into the details of each one. Table 1 shows the steps for each phase of the project: design, realization, testing, and go-live.
- Identify the overall analytical area that you need to bring into the data warehouse
- Gather front-end requirements for the queries that are part of the new model
- Put together a data model specifications document
- Conduct a design review session
|
- Develop the back-end model within the data warehouse
- Complete the front-end development (e.g., queries, views, and broadcasts)
|
- Conduct unit and integration testing
- Obtain user acceptance and train the users
|
- Transport back-end and front-end components to your productive SAP NetWeaver BI environment
|
|
| Table 1 |
Steps for each phase of creating a BI design-centric development process |
Note
In my example, I assume that the final product is a query. However, you could also use this process for concepts such as a graph on an executive dashboard or a formatted printed report.
Design Phase
Step 1. Identify the analytical area. It is crucial that concrete business requirements determine which analytical areas you plan to bring into the data warehouse. One of the most common mistakes is to develop the plan of rolling out analytical areas based solely on internal IT discussions with little input from the business. The idea that the BI team should simply roll out generic BI content for heavy transactional areas such as Sales and Distribution (SD), Purchasing, and Financial Accounting (FI) just for the sake of having them within the data warehouse is not only inefficient; it is also unlikely to produce anything valuable to business users.
Start by identifying a list of specific analytical queries and reports that business users desire the most. Your initial business audience should be comprised of upper management to promote the use of the BI content when it is developed. The top-down approach is most effective when it comes to driving usage, following the principle “if your boss knows about it, you should know about it.” After you have compiled the list of specific queries and reports, group these items into logical analytical areas, such as sales, billing, and vendor rebates.
Step 2. Gather detailed front-end requirements. Next, you need to put together a front-end BI specifications document for each of the queries that you identified in step 1. This requires close communication with the business users, because they should ultimately be the ones who decide on how the queries should function.
If the business users do not have a thorough understanding of how BI queries work, start by demonstrating a typical BI query within BEx Web Analyzer to help them visualize the framework of the final product. After you have mentally established the basic framework — including the presence of characteristics and key figures, default rows and columns, free characteristics, and global filters — put together a complete set of BI front-end functional specifications.
A good BI front-end functional specifications document should include a solution overview, query specifications, views, and testing scenarios. In addition, if they are relevant, you should also include portal integration and information broadcasting.
Solution overview. This is an overall purpose statement for the query. Here you create a table that details the types of users that will use the query. You can use a simple table that includes the user role, reason for using the query, and planned frequency of use.
Query specifications. These are the query properties, including the title and settings such as suppression of rows with zero values and location of subtotals. The properties include:
- Global filters with filter values specified for each relevant characteristic
- Default drill-down, drill-across, and free characteristics
- Variable screen definitions that specify the characteristics and types of selection variables to use, such as single value or selection, and required or optional
- Key figure definitions including straight, calculated, and hidden key figures
- Report-to-report interface specifying any target queries or SAP ERP transaction codes
- Any required conditions and exceptions
Views. Include any necessary additional views, specifying the variations of default rows and columns
Testing scenarios. This section should include specific variable/filter selections and expected results that you can use for initial unit testing
Portal integration. Specify how you plan to present the new query on SAP NetWeaver Portal, if relevant
Information broadcasting. Specify the frequency of broadcasting and recipients, if relevant
After you have a BI functional specifications template in place, try integrating any known best practices into this document. For example, never include authorization-relevant characteristics (e.g., company code, sales org, purchasing org, plant, or sales office) on the variable screen. Instead, assign authorization variables to those characteristics in the query definition. Then the results of the query are automatically filtered by the values that the user has access to, minimizing the number of authorization errors.
For the variable screen, only use characteristics that are either time-relevant (e.g., calendar year/month) or have many possible unique values (e.g., customer or material). Keep this screen to a minimum or avoid using it altogether when possible. The users can filter within the query itself.
Step 3. Compile the data model specifications. After you iron out the front-end requirements, you can proceed to one of the most critical steps in the entire process — putting together the back-end data model specifications. I cannot overstate that you must compile this document prior to any back-end work in the actual data warehouse. Minor mistakes on the back end can result in many hours of re-work or, even worse, an unusable solution.
Data model specifications are only practical during rollouts of new, medium-to-large size analytical areas. For example, it would be a complete waste of time to fill out this document when all that is required is to create a new MultiProvider on top of existing InfoCubes. As in the case of front-end requirements, gathering a solid reusable template document is important. The data model specifications take quite a bit of effort to put together, but when done correctly they drastically decrease the amount of time spent on actual hands-on back-end development work.
A data model specifications document should cover the following areas:
Characteristics. Develop a detailed list of all the required characteristics, including the name of the existing or new InfoObject, master data, time-dependency, text, and hierarchy requirements. You should also provide a list of all the relevant attributes for each characteristic. Specify any compounded characteristics that are required for the model and any hierarchies and their respective structures that you need to implement.
Key figures. Create a detailed list of all the required key figures, including the name of the existing or new InfoObject, type, length, and associated unit. Specify the aggregation settings for each key figure as MIN, MAX, or SUM. This is a critical step. In certain instances — for example, reporting on the latest date — you achieve the desired result only via exception aggregation settings on the back end. Make sure to list all the key figures marked as non-cumulative or set as counters. Also, include the key figures that are calculated in the updated rules with the details of the logic of the actual calculation.
InfoSources. Define the transfer structures, including the mapping between the InfoObject and ERP table and field name. Also define the transfer rules, including the details about any logic within a routine, formula, constant, or master data attribute.
Note that the InfoSource relationship table uses the standard database table relationship methodology: one-to-one (1:1), one-to-many (1:M), or many-to-many (M:M). This helps prevent duplicate data on InfoSources that have a parent-child relationship.
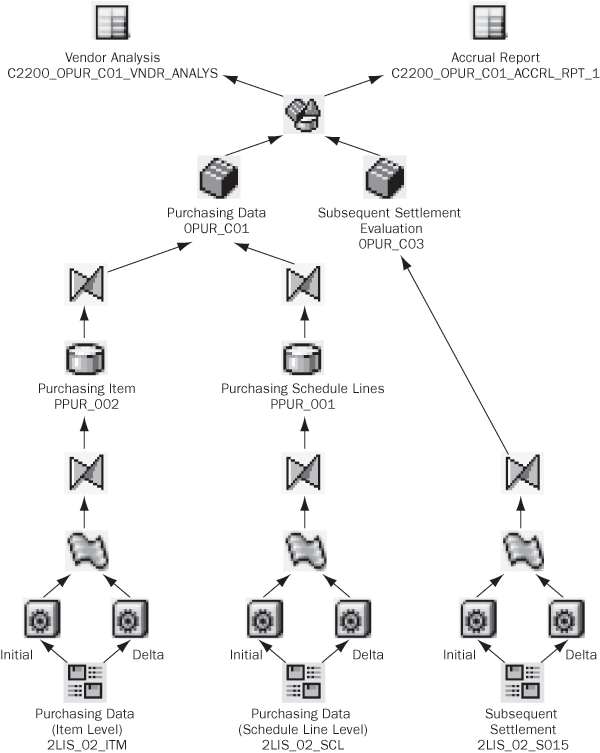
Data flow diagram. Create a graphical diagram that represents the actual flow of data within the model, starting at the lowest level that you are creating or changing. An example of a common data flow diagram pattern in a completely new model is InfoSource>Transfer rules>Update rules>EDW DataStore object (DSO) layer>Update rules>Reporting DSO layer>
Update rules>InfoCube layer>MultiProvider. You can use software such as Microsoft Visio to put together a data flow diagram using a set of standard graphical shapes. Figure 1 shows an example of a complete data flow diagram

Figure 1
Data flow diagram
Be cautious about including DataStore objects and InfoCubes without delta capabilities. Such objects require a full reload of data every time a data update from the SAP ERP system is requested. Although in some instances such data flow design is necessary, BI teams should do everything possible to avoid this scenario as it significantly affects the runtime of periodic process chains.
Star schema diagram. You should create a star schema diagram for each InfoCube that you create or change. It is crucial to think through the design of each dimension within a star schema because poor dimension design can result in significant performance issues.
Generally, you can consider any dimension that has more than 10,000 unique rows as large, so you need to evaluate it carefully. Ensure that characteristics within a single dimension have relationships. Also, consider marking a dimension as a line item dimension, but only if the dimension is expected to grow at the same or higher rate as the fact table.
If you have fewer than 14 characteristics, then you should place each characteristic into its own dimension. Apart from the standard SAP dimensions of unit, time, and data package, dimensions should have an estimated row count of unique value combinations designated in the top-right corner of the dimension on the star schema diagram. You should also designate attributes as navigational (N) or display (D) attributes. Figure 2 shows an example of a star schema diagram.

Figure 2
Star schema diagram
Enterprise data warehouse (EDW) layer. The EDW layer contains DSOs that have a minimal amount of transformations performed to the raw data from the transactional system. The EDW layer feeds the data marts within the data warehouse. For the EDW layer, make sure to list all the DSOs that you are either changing or creating. This includes the key characteristics, navigational attributes, and key figures for every DSO. Describe the logic of any ABAP update rules that you need to maintain.
Data mart/InfoCube layer. List every InfoCube with its corresponding characteristics, navigational attributes, and key figures that you are changing or creating as a result of the new implementation. Describe the logic of any ABAP update rules that you need to maintain.
Aggregates. With the introduction of BI Accelerator technology SAP has made it possible to achieve astounding query response time without the use of any aggregates. However, many IT shops are still either running BW 3.5 or cannot justify the expense associated with the purchase of additional hardware required for a BI Accelerator implementation. In that case you should give careful consideration to the design and management of aggregates within the data warehouse.
Although you can easily create aggregates after implementing the data model, it is usually considered a good practice to deliver a few aggregates with the original solution to ensure optimal performance. You should classify aggregates as reporting or Basis aggregates. Reporting aggregates speed up query performance and Basis aggregates are used to create
the reporting aggregates. Each aggregate should list the characteristics and navigational attributes within it. Aggregates can be especially effective in models that are heavy on navigational attributes.
MultiProviders. You should create a MultiProvider for every model. You should always build queries against a MultiProvider, rather than the actual InfoCube, even if you have only one InfoCube within the MultiProvider. This allows for greater flexibility when making changes to existing models and minimizes the impact on end users. For every MultiProvider, list the InfoCubes that are part of it.
Data volume analysis. Provide an estimate of how many rows are within the fact table for each InfoCube that you create. Maintain the proper size category for each object, which you can access by following menu path Extras>Maintain DB storage parameters while in the change mode for an InfoObject, InfoCube, or aggregate. Refer to Table 2 for the proper settings.
| InfoObject |
Fewer than 50,000 records |
More than 50,000 records |
| InfoCube |
Fewer than 3 million records |
More than 3 million records |
| Aggregate |
Fewer than 3 million records |
More than 3 million records |
|
| Table 2 |
Maintain proper size categories |
Step 4. Conduct a design review session. Before you start any actual development, you should present the front-end BI requirements document (what the business needs) and the data model specifications (how you are going to do it) to applicable management, BI analysts, and any other employees who have expertise in the subject discussed. The focus of the design review session is to put the proposed data model to the test by taking into account naming convention standards and known best practices. Figure 3 contains a suggested checklist of items that you need to address during the design review session.

Figure 3
Checklist for design review session
Realization Phase
Step 5. Perform the back-end model development. This should be the first time you perform actual modeling within the data warehouse. The BI analyst can simply follow the data model specifications document that you created in step 3 and complete all the necessary configuration steps. It should take less time to physically create the model within the data warehouse now because you already thought out the design alternatives in the previous steps. The design model specifications document provides a complete back-end blueprint for the BI analyst to use, which ensures that best practices are applied.
Step 6. Perform front-end development. After you finish the back-end modeling you can begin developing the front-end queries, workbooks, reports, and dashboards based on the requirements that you determined in step 2. You have invested a significant amount of time in the design phase to bring a new data model into a data warehouse, so you should minimize the number of changes performed to the back-end model at this stage. As with step 5, the BI analyst creating the queries can simply follow the front-end BI requirements document and focus on performing the work within Query Designer as opposed to tackling design questions.
Testing Phase
Step 7. Unit and integration testing. It is no secret that testing is crucial to any successful IT implementation, and BI is no exception. It is advantageous to engage an SAP ERP business process analyst in the internal unit and integration testing of an analytical BI model. In fact, IT shops should encourage ERP business analysts to perform BI front-end development in step 6. Ensure that you test any delta data packages thoroughly. This is important because you uncover most of the back-end mistakes only through delta-load testing.
Step 8. Conduct user testing and acceptance. Don’t fall into the trap of moving a model into a productive environment that end users have not reviewed and tested. BI teams face many challenges in getting their functionality properly tested. It is difficult to keep a BI QA environment in sync with an SAP ERP QA environment that production constantly refreshes. In addition, BI end users are typically more resistant to testing with outdated data than they are when they test transactional changes within SAP ERP. In BI environments, the entire focus is on data, so users tend to be more worried about the validity of data and naturally find it harder to test with outdated information. These issues lead many companies to transport BI models prior to any formal user acceptance.
Despite all these challenges, do everything possible to conduct thorough and meaningful user acceptance for any new front- end deliverables. Consider using Information Broadcaster to send a link to a query that you need the test users to test in your development or QA environment. Identify transactions and selection criteria ahead of time that you can use to reconcile the results of your BI queries and communicate those to your end users involved in the testing effort.
Go-Live Phase
This phase is fairly self-explanatory and involves the transportation of back-end and front-end components to your productive BI environment. The actual process of transporting changes, especially involving back-end components, is quite complex. Refer to Sushrut Shrotri's “A Strategy for Collecting and Transporting BW Requests” (Volume 1, Number 2), available in the BW/BI Expert knowledgebase at www.bi-expertonline.com, for a great guide on how to accomplish this. Each BI team should have a clear documented procedure for collecting the back- and front-end changes into a transport via Transport Connection in BI Administrator Workbench (transaction RSA1).
Note
For more information about this topic, consider attending the SAP Education course BW330 "Business Information Warehouse — Modeling" for SAP NetWeaver BI 7.0.
Anton Karnaukhov
Anton Karnaukhov is a senior IT manager at Pacific Coast Companies, Inc., in Sacramento, California. He earned an MBA degree at Heriot-Watt University and a BS/BA degree with a specialization in computer information systems at Western Carolina University. Anton has more than eight years of SAP implementation and development experience focusing on business intelligence and logistics modules in the manufacturing and resale industries.
You may contact the author at anton.karnaukhov@paccoast.com.
If you have comments about this article or publication, or would like to submit an article idea, please contact the editor.


