Learn the basics for how to do all three types of linking from a Web Intelligence (WebI or WEBI) document. The newest versions of BusinessObjects make this linking easier than before.
Key Concept
In Web Intelligence documents the concept of linking is the ability to select part of a Web Intelligence (WEBI or WebI) document and have it jump you to various targets, such as Web pages and other BI documents.
Adding links to Web Intelligence (sometimes referred to as WEBI or WebI) lets analysts jump from summary to details or to sites providing more information, including other reports or sites on the Web. This feature has the ability to “remember” the context of the cells you were on in the starting report and pass this to the linked object, which helps keep your analysis path (mind) on track. Many reporting tools—not just those offered by SAP Business Objects—provide this type of feature. For the older BEx tools, this feature was called Report to Report Interface (RRI); in BusinessObjects this feature is called Open Document linking.
I cover the basics of all the link types. The most important might be the concept of linking between BusinessObjects documents (Open Document linking). Additionally, I discuss three other types of linking: element linking and linking to external URLs. Linking becomes a little bit more complex when you start exploring all the options. For that reason, I have split my discussion into two separate articles. This first one covers the basics of linking in Web Intelligence; my second article goes into more detail about the advanced concepts of Web Intelligence linking.
Figure 1 identifies all the types of linking I discuss in this article by showing an example of a Web Intelligence document and what links are hot (meaning that linking for these highlighted areas of the report has already been configured).

Figure 1
A sample Web Intelligence document with extensive linking configured
The details of Figure 1 guide the rest of this article, and I show you how to configure each feature identified in this example.
Bubble 1 shows that that the state has been configured with a link. The element link acts as a user control to filter the associated graph (on the right) to the state the user clicks (California). To remove the filter, select the state (California, in this example) and then click the Clear Filters button.
Bubble 2 points out that that the click to go to SAP.com text has been configured with an external hyperlink. Clicking it takes you to the SAP.com site.
Bubble 3 shows that that the numbers in the Margin column have links configured. These open document links jump users to another, more detailed Web Intelligence document for the state and year related to the selected margin value.
As you see in Figure 1 linking can be embedded anywhere on the screen—on a cell, on a chart, on a block of data in a table, or just about anywhere you would want it. These examples should get you thinking about your design. While you are thinking about how to design your links, consider this point: Putting a link on a cell positioned at the top of a block might mean that link applies to analysis of data in the block; however, putting links in the report header are intended to supply additional data related to the whole report.
Now that you understand the links’ purposes and have thought about how and where you want to apply them, you are ready to create them. In the following sections I show you the tools you need to use when applying links. For each link type discuss I show you how to configure it and explain some of the available options. Finally, you might need to remove an existing link because it is not valid or relevant. I show you how to do that as well.
General Linking Setup
As an experienced Web Intelligence user you know that Web Intelligence has a read mode (end user) and two flavors of Design mode: With and without showing data (Structure only). It also has deployment options as shown in Figure 2. Although you can configure some types of linking in Design mode using all three of these deployment options available for Web Intelligence, only one mode lets you configure all three types of links (element, hyper, and OpenDocument links): The Applet version. In addition, I find the Structure only Design mode works best.
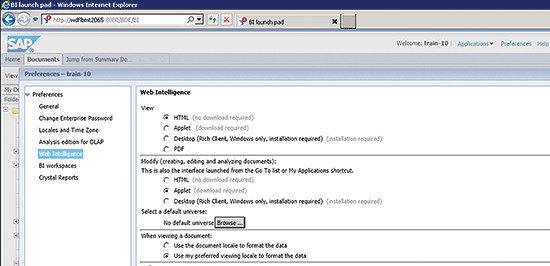
Figure 2
Set your Web Intelligence preferences in the BI launch pad
Figure 2 shows my own test system and the Applet version of Web Intelligence in use. This version lets you configure all types of links. From your BI launch pad, click Preferences in the top right of the screen. When the Preferences pop-up window opens, click Web Intelligence in the left pane. This opens the right panel to show the Web Intelligence options. In this screen under View, select the HTML (or any viewing option) radio button and the Applet (download required) radio button under Modify (creating, editing, and analyzing documents). Note that the section When viewing a document at the bottom of the screen has nothing to do with linking, so choose any option you desire and click the OK button to save your settings.
Again, you configure or create the links in Design mode. End users can use the links set up by the Web Intelligence designer in Reading mode (Figure 3). As mentioned previously, I prefer to use the Structure only Design mode for creating links. To choose your mode start at the upper right corner of a Web Intelligence document as shown in Figure 3. As the names indicate, one Design mode lets you design your link while looking at the report data on the screen (With Data), whereas the other is more compact; it just shows the structure of the tables without the actual data (Structure only).

Figure 3
Choose your Design mode
Linking Configuration Details
In this section, I show the details of each link method and how to access the options and the setup needed to get the links to work.
Element Linking
The element linking example is the focus of Figure 4 (e.g., by state). In this screen you want to create an element link so that the selected state’s information (California, in my example) is linked to the pie chart. This way, each time a state is selected in the State column, the information contained in the report’s pie chart only shows the data related to the selected state. In addition, Figure 4 shows the automatic graphical changes that occur when an element link exists. After you expand the Input Controls box in the upper left, the automatically generated input control box Click on State in Table is displayed. This box enables you to unset any filters. The small icon (circled to the right of the Margin column) shows you the information that linking exists somewhere on this screen.

Figure 4
Select the state’s element link
Here’s how you configure the link. From the context menu (right-click on any cell in the box in Figure 4—e.g., the first amount in the Margin column) you can start configuring all your linking options. From this point forward your options change a little depending on what you want to do next. Figure 5 shows the Design mode context options for linking.
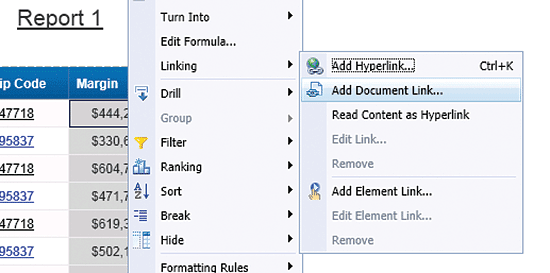
Figure 5
Linking options in general (via the context menu)
Note
Access the context menu of any cell (Figure 5) to show your linking options.
In this example you want to link the element pie chart to the state field in the table so access the menu path shown in Figure 5 by selecting the context menu of the State field. Select the Add Element Link (Figure 5). Once selected, this opens the screen in Figure 6 where you define the name of your link.
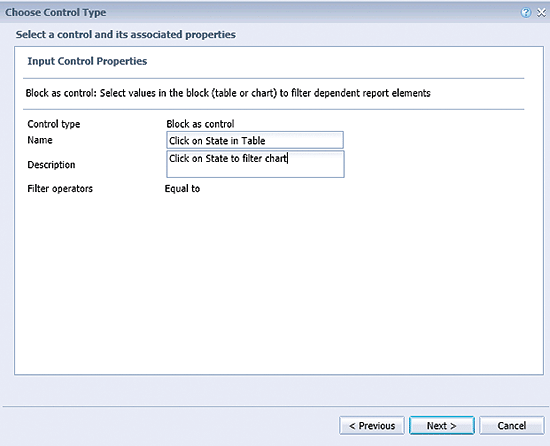
Figure 6
Define the name of the input control
Figure 6 is the first step in the Wizard that walks you through the process of creating your element link. The Control type is set as the default Block as control. Enter the input control’s Name (Click on State in Table) and Description (Click on State to filter chart). Finally, enter Equal to as the Filter operators because you want to have the system include only the state selected (and not, for example, exclude it). Click the Next button, which opens the screen in Figure 7.
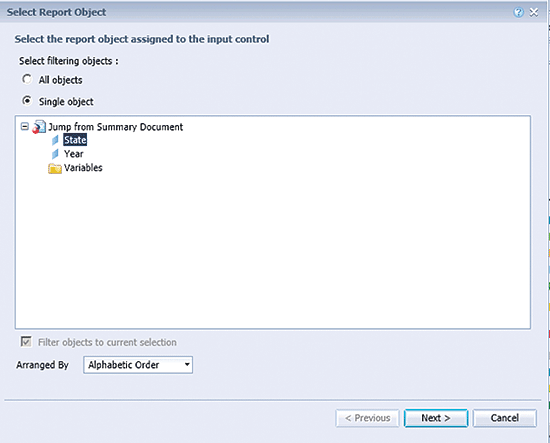
Figure 7
Select the objects in the element link
The entries in Figure 7 determine what the link does. In this example you only want the pie chart to change for the detailed row’s state, not for both the state and year. So you select the Single object radio button. The only other option is to choose All objects in which case you would not be allowed to select individual ones, and then, by default, the pie chart would be filtered by both state and year.
Next you have to select the field to link to, so choose State. You want the object sorted by name, so choose Alphabetic Order from the Arranged By drop-down options. Once you’ve completed your entries, click the Next button, which opens the screen in Figure 8. In this case, your link is designed to link to the current document’s elements, so when you click Next, the system allows you to choose what specific elements on this document the link controls.

Figure 8
Select the elements that are filtered by the link
The final step in the configuration of the element link is to determine in what elements of the report the link should affect the filtering. In this case you only have one other object (other than the table) that you want to contain a link, and that’s the pie chart—Block 2 (note that the Block 2 check box has the little pie-chart symbol next to it). As Figure 8 shows, you have the option to control the entire page body and all the blocks in it. If you want more global control you can select more options here assuming you have more elements that you want the link to filter. This is a design decision and it depends on the analysis tasks at hand.
After you make your selections in Figure 8, click the Finish button to create the link in the State field of the table.
Only two more steps remain for linking elements. The first step is to un-set the filter and return the pie chart to its original all-states display. To do this you must clear the filter using the input control that was automatically created by the process. The second step requires a little experience. By that I mean that the only way for you to know to click State (or any other link) for something to happen is through training and familiarity with the system. In this case, be mindful of the simple icon at the top of the table (Figure 4) that indicates that element links exist, and use the special input control to remove those filters if you apply them.
Hyperlinking
The second linking example (the click to go to sap.com link in Figure 1) is a hyperlink to Web content. When you click the click here to go to sap.com text, the Web site (Figure 9) opens in a new window. Although this is a very straightforward hyperlink to an external site when linking from normal text, don’t attempt this process using an image until you read my other linking article. [insert link to article]

Figure 9
A simple Web site linked to the Web Intelligence document
Most of steps to make a link a normal hyperlink to a page are the same as my element link examples. The difference is that, in Figure 5, instead of choosing the Add Element Link… option, you choose the Add Hyperlnk… option. Once you do that, the options in Figure 10 appear.

Figure 10
Web page hyperlinking options
This is my simplest example. Enter the URL for the site you want to link to in the top box and, depending on whether you want that site to open inside the launchpad or in a new window, make your Target window selection. Then enter a Tooltip (e.g., Go to the SAP Training Web Site). (The Tooltip is the hint users get when they hover their cursors over the link.) Click the OK button to save your new hyperlink.
Open Document Linking to Another Web Intelligence Report
In this final example I discuss how to link to a details document and how to pass parameters so that the receiving document is automatically filtered when it is opened. This idea of linking a summary to the details of a document is a great option, and it offers advantages from the perspectives of performance, usability, and security.
The completed task is shown in Figure 11. This is the detailed sales report (by state and year) that was accessed by clicking the hyperlink in the Margin column for California and 2013 (Figure 1).

Figure 11
The detailed report by year and state
Note
There is no requirement to have the receiving document be on the same universe, but it often makes things simpler if the object names are the same.
There is some basic set up you should do for the Web Intelligence document you are linking to (in my example, this document is called Jump to Detailed Report). Technically, these steps are not required, but they are a good idea if you want a good overall design and user interaction experience. These are:
- The receiving report needs prompts. In my case these are on year and state (Figure 12). Without these prompts, the sending report cannot pass parameters.
- The well-designed receiving report would have a dynamic title using these prompts. For Web Intelligence beginners, the receiving report title is a simple cell that, when clicked, gives you access to the formula for that cell. The changes I made are shown in Figure 13. The user response contains the values of the prompted filters, which in this case is populated by the Jump from Summary Report.

Figure 12
Prompted query filters for the receiving report

Figure 13
The report title formula for the detailed (jump to) report
Now for the details for how to configure the link to the details contained in the summary document. Again, starting from the same link menu (Figure 5), select the Add Document Link… option. This opens the screen shown in Figure 14 that shows your link-to options.
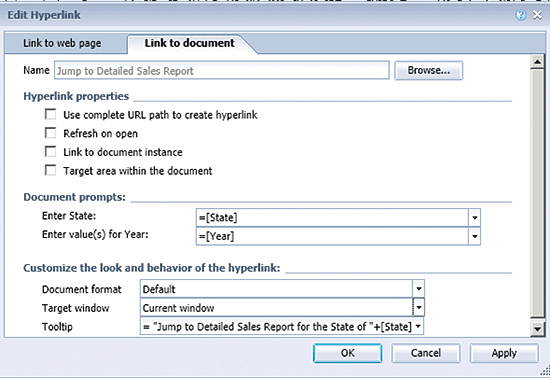
Figure 14
Basic options for linking to a document
The report (the one you are linking to) has to be found. Click the Browse… button to search for the required report—in my example it’s named Detailed Sales Report. Once you find the report, click it, and then click the Open button to upload it.
In the Documents prompts section you are giving the system the logic it needs to assign the prompts you previously added to the target report. In my case the formulas =[State] and =[Year] assign the state and year as selected from the summary report. Another option might be to assign a hard-coded 2014 or other value in the formula.
In the Tooltip field a formula is assigned to show the user a hint about where the link will take them when they hover over it (in this case, over Margin). In this example, the hint is = “Jump to Detailed Sales Report for the State of” +[State]. Most of the fields in Figure 14 are auto-populated with the necessary information; you only need to choose the document that contains these prompts.
Once you upload your report and review the information contained in the other fields in Figure 14, click the OK button.
The linking steps I cover here are the basics for linking from a Web Intelligence document. For more advanced linking options, please read my companion SAP Experts article, “More Advanced Tips for Web Intelligence Linking.”
Ned Falk
Ned Falk is a senior education consultant at SAP. In prior positions, he implemented many ERP solutions, including SAP R/3. While at SAP, he initially focused on logistics. Now he focuses on SAP HANA, SAP BW (formerly SAP NetWeaver BW), SAP CRM, and the integration of SAP BW and SAP BusinessObjects tools. You can meet him in person when he teaches SAP HANA, SAP BW, or SAP CRM classes from the Atlanta SAP office, or in a virtual training class over the web. If you need an SAP education plan for SAP HANA, SAP BW, BusinessObjects, or SAP CRM, you may contact Ned via email.
You may contact the author at ned.falk@sap.com.
If you have comments about this article or publication, or would like to submit an article idea, please contact the editor.