Strategic Supply Chain Management, Part II of II
Understanding Dashboards and Scorecards for Effective Decision-making
By Venkata Ramana Nethi CSCP, CPIM, Business Process Lead – Operations, Schlumberger
In Part I of this two-part series, Understanding what to measure for effective KPI development, key performance indicators (KPI) were defined, the article reviewed how to develop effective KPIs for your business, and several examples of KPIs that have proven effective for the different domains in the value chain, regardless of the industry, were provided. In this article you will learn the framework and audience for dashboards and scorecards and the driving factors of each. When to use an operational, tactical, or strategic dashboard based on business objectives and audience will be explained, along with the principles and benefits of each type. This article will also provide the design thinking process for dashboards and scorecards.
Monitoring KPIs at a glance and running through massive amounts of data in a couple of clicks is essential to effectively manage business operations, level of aggregation, and determine which details to drill down on as part of your continuous improvement plan. It also helps operational, tactical, and strategic management teams solve problems quickly, efficiently, and effectively.
Explore related questions
Although both dashboards and scorecards can provide insight into an organization’s progress and performance, each tool offers a different type of view, serving its own purpose and usage, collecting data that provides separate, but related, measures.
Management consultants must have a thorough understanding of these differences to determine when a dashboard, as opposed to a scorecard, will deliver the desired results for monitoring the health of an organization’s deployed processes, and vice versa. Let’s examine the basic differences and go through real-life examples from successful implementations of each tool.
Understanding Basic Differences Between a Dashboard and a Scorecard
When deciding between using a dashboard vs. a scorecard you must first identify what the organization wishes to measure: operational performance and metrics monitored in real time and compared to target values (dashboard) or overall business performance as compared to goals and KPIs (scorecard). A dashboard can help improve daily efficiencies and departmental performance, while a scorecard can help an organization make strategic decisions based on a company’s overall progress (or lack thereof). The following sections provide more detailed definitions of each tool.
Dashboard
A dashboard collects information from various datasets and displays this information in a central location, often in the form of tables and charts, to help organizations track operational performance in real time. Unlike a scorecard, this data is updated continuously and can be used to make decisions that impact the efficiency of day-to-day operations and management of teams, resources, and expenses.
Your car dashboard works similarly to a business dashboard in the way that it displays detailed data in near real time so users can identify potential areas of improvement, such as attending to a low gas meter or a check engine light.
Scorecard
A scorecard demonstrates a business’ performance as it compares to overall strategic goals. It helps executives track progress and review performance with departmental managers toward achieving those goals. Scorecards usually display performance in weekly, monthly, quarterly, or annual increments. Data is typically shown in summary format, which can reveal trends and inform business objectives (as opposed to a dashboard view, which shows data results in real time from an operational perspective).
A scorecard can be best compared to a student’s report card, which shows a person’s academic performance over time (i.e., quarterly, annually) as it relates to a strategic goal or KPI (i.e., a rating or grade).
Driving factors behind dashboards and scorecards
Table 1 contains the driving factors of a dashboard vs. a scorecard. You should consider these factors before choosing which tool will best meet your business needs.
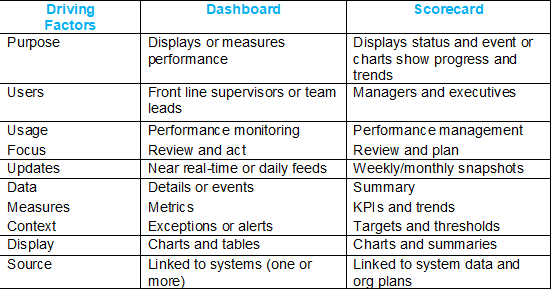
Table 1 Dashboards vs. scorecards – driving factors
Three Types of Dashboards
As previously mentioned, dashboards can be classified into three types depending on the audience and objectives:
- Operational dashboard—Front line supervisors use operational dashboards to monitor the efficiency of the execution processes. In general, the operational dashboard provides a simple display showing only the information users need to be productive on a single screen, with controls that let them change the view in place. An operational dashboard is critical for fast-moving business; users should be able to glance at an operational dashboard display to get all the information they need to do their jobs rather than having to navigate a complex data environment. Examples of an operational dashboard include Production Readiness, Planned Order Status, Production Order Exception Messages, Work in Progress and Lead time Analysis.
- Strategic dashboard (AKA scorecard)—Executives use strategic dashboards, also referred to as scorecards, to review progress toward achieving strategic objectives in monthly or quarterly review meetings with business units and departmental managers. The scorecard contains summary-level data updates monthly or quarterly from operational systems and is focused on the future in the form of objectives and goals, and how to achieve them, typically deployed in a top-down fashion to manage the execution of strategy on an enterprise scale. Examples of a strategic dashboard/scorecard include Supply Chain Executive Dashboard and Plant Operations Score Card.
- Tactical dashboard—Managers use tactical dashboards to analyze performance against strategic business goals, and executives use tactical dashboards to view summary data for the entire organization. The purpose of a tactical dashboard is to analyze the efficiency of departmental activity so that managers can proactively take actions to address problems and redefine thresholds or identify exceptions. Examples of a tactical dashboard include Customer Order Management and Buyers Dashboard.
The framework in Figure 1 shows how the three types of dashboards communicate information across the different levels within an organization.
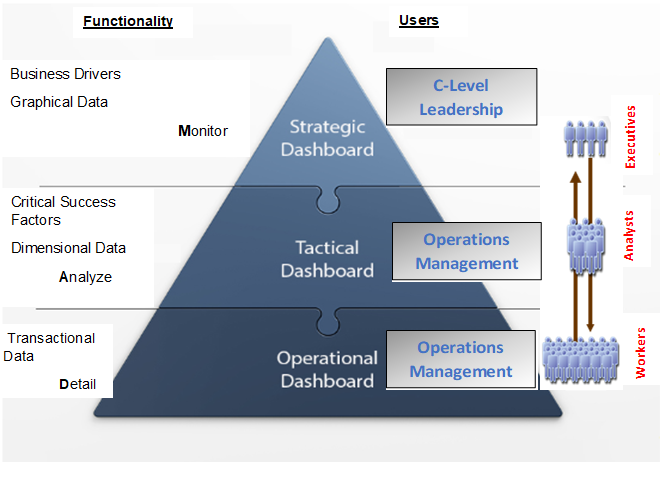
Figure 1 Dashboards framework
Design Principles to Consider for Dashboard and Scorecard Development
One organization used their scorecards and dashboards to build reports in SAP Business Intelligence to help them monitor, measure, and track trends to support continuous improvement. They used the following user-experience-driven design principles to create the dashboards and scorecards that fed these reports:
- Use the framework that is supported at the divisional level (group of plants/manufacturing sites)
- Ability to drill down the details in couple of clicks
- Link each level of data (sales, production, purchase, planned order) by pegged requirement
- Store required process owner status info at each level with date/time/user info
- Support commonly required transactional updates to SAP data
Tips for success
- Take advantage of near real-time updates in operational dashboards. You may choose to set your updates to happen every 30 minutes, daily, weekly or monthly to provide actionable information depending on product lead times.
- Use aggregated data in tactical and strategic dashboards, charts, and tables for presentation to mid- and Csuite-level management.
- Keep it straightforward. Add complex analytics or drill downs to screens so users can see all the data they need in a single glance.
- Use agile or scrum model deployments. Methodology requires a small team of developers and business to develop dashboard screens.
- Last but not the least, encourage friendly competition by displaying individual or departmental scores and rankings.
Examples of Dashboard and Scorecard Implementations
You should now understand the basic differences between a dashboard and a scorecard, as well as each tool’s driving factors and recommended design principles. The second half of this article provides examples of successful implementations for the different dashboard and scorecards types in the manufacturing, sales and marketing, and supply chain domains.
Operational Dashboards are used to monitor, control and increase productivity
The emphasis of an operational dashboard is on monitoring, rather than analysis, and updates should occur in near-real time or at a daily interval.
Manufacturing organizations that make products via production orders with relevant master data prerequisites like bills of material, routings, lead times, etc., need tools like the operational dashboard to manage operational activity of front-line workers and deliver near real-time data so the users can work proactively to address problems before they impact the bottom line.
Example of operational dashboard in action
At one manufacturing company, planners use an operational dashboard as a visual representation of their internal benchmark status. The dashboard allows them to use an analytical model to identify potential areas of improvement by extracting data in near real time or every hour.
Planners also use the dashboard to monitor production readiness on the shop floor to track planned orders, production orders, and material requirements planning (MRP) exception messages, as shown in Figure 2. (The following SAP order statuses and tables are guidelines, you may refer to your organizational standards for mapping.)
The following statuses provide a count of planned orders that can be converted to production orders and those that are incomplete:
- Ready: Ready indicates planned order can be converted to production orders
- Not Ready (MSPT): Not ready for conversion because of planned order has missing parts (MSPT)
- Not ready (Rtg Sts): Not ready for conversion because of routing status is other than released
- Not ready (matl status): Not ready for conversion because of material status is other than Plant specific status like “Released” or “Minor Revision”
The following production order exception messages provide a snapshot count of production orders that have critical exception messages on given run date and date from prior months:
- Reschedule In: Orders with Reschedule in message: Exception group 7 Element 10
- Reschedule Out: Orders with Reschedule out message: Exception group 7 Element 15
- Prod Orders Cancel Messages: Orders with Cancel message: Exception group 7 Element 20
- Prod Orders Finish Date in the Past: Orders with finish date in the past: Exception group 3 Element 7
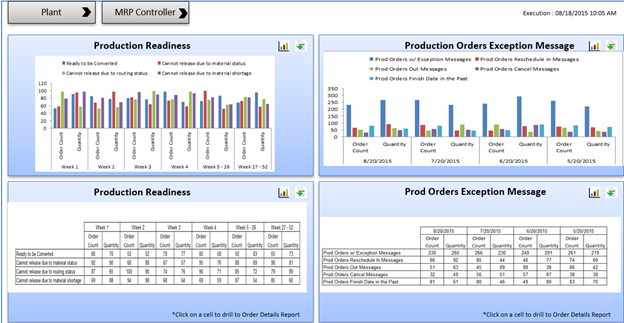
Figure 2 – Example of operational dashboard – production readiness and exception messages
Planners need to evaluate orders, work-in-process (WIP) and exceptions on a daily basis to keep up the planned schedule and report out issues to resolve with cross functional teams (Figure 3).
The following calculations provide a measure of production order lead times and purchase order lead times from external operations in monthly buckets.
Calculate average production order lead time (days)
- Select all production orders with Delivered (DLV) status.
- Determine the number of days between actual release date (AFKO FTRMI) and Latest Goods Receipt Date from Material Document.
- Divide by number of production orders.
Calculate average EXTL purchase order lead time (days)
- Select all external operation purchase orders with GR receipt checked and calculate.
- Number of days between purchase order creation date and purchase order.
- Delivery Date and divide by number of purchase orders.
The following provides a report of work in progress (WIP) orders by broad category of order types. The in tabular form shows additional information about the number of purchase requisitions and purchase orders created from these work orders:
- Total Released Production Orders
- Production Orders: Order types PP01 (more may be applicable in some other industries)
- Rework Orders: Order types RW
- Add-on Orders: Order types without materials, generally used to capture Project Costs, Expense/Tooling, Indirect Activities, R&D
- EXTL Purchase Req. Created: Number of purchase requisitions created from Work-In-Process (WIP) orders.
- EXTL Purchase Order Created: Number of production orders created from Work-In-Process (WIP) orders.
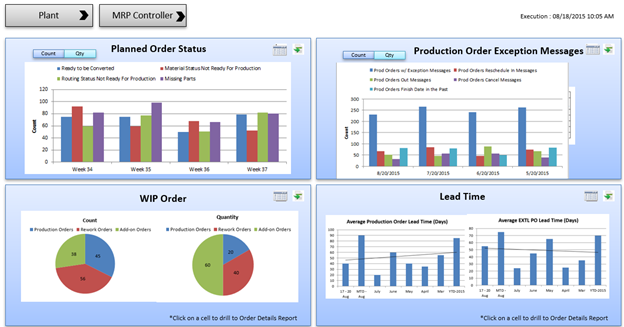
Figure 3 Example of operational dashboard – production order status and exception messages
Tactical dashboards are used to display KPIs for multiple departments
Tactical dashboards emphasizeanalysis, rather than monitoring, and are used to optimize business process in various departments such as sales, marketing, and manufacturing. One example of a tactical dashboard is a ‘Plant Performance Dashboard’ (Figure 4). They also provide an enterprise view across all departments as well as links to various other departmental dashboards (Figure 5).
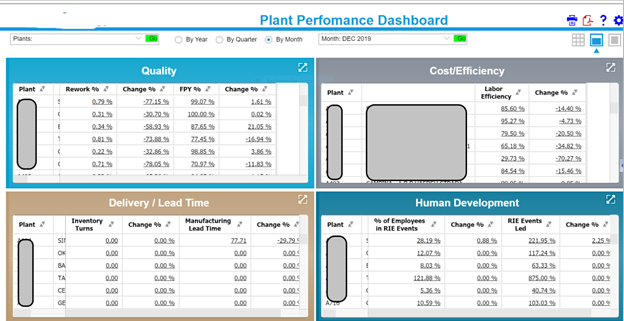
Figure 4 Examples of KPIs covering quality, cost/efficiency, human development and delivery/lead time
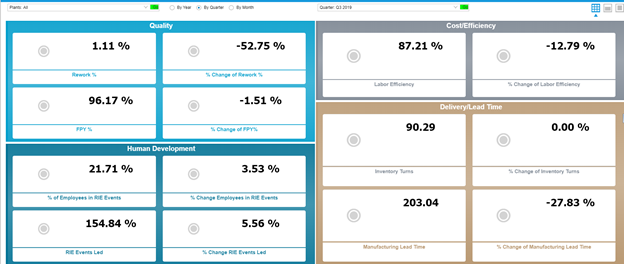
Figure 5 Examples of KPIs covering quality, cost/efficiency, human development and delivery/lead time
In Figures 6 and 7, the tactical dashboard displays ‘Customer Order Management’ analysis by manager in various dimensions.
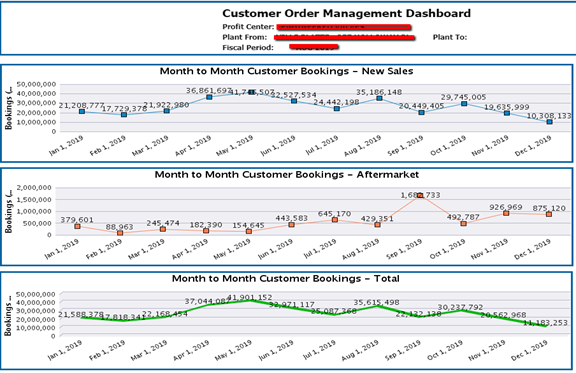
Figure 6 Tactical dashboard analysis – customer order management – bookings
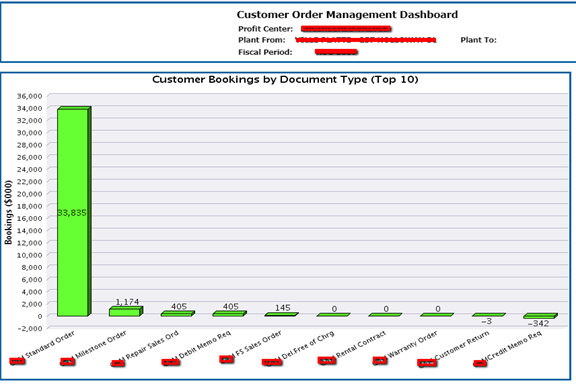
Figure 7 Tactical dashboard analysis – customer order management – bookings
Material managers analyze the procurement activities of products using a procurement dashboard (Figure 8).
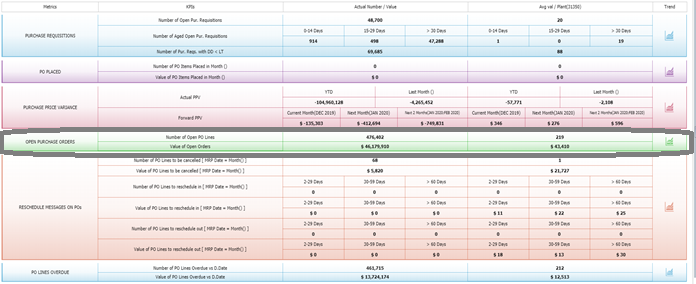
Figure 8 Procurement dashboard for managers, example from manufacturing industry
Tactical dashboards should provide the ability to drill down into details for analysis, as shown in Figure 9, where users can click on the icon highlighted to view summarized details. Other areas for drill down may include number of purchase order (PO) lines overdue vs. delivery date, as shown in Figure 10, or value of PO lines overdue vs. delivery date, as shown in Figure 11.
![]()
Figure 9 Section representing open purchase orders from sample buyer score card
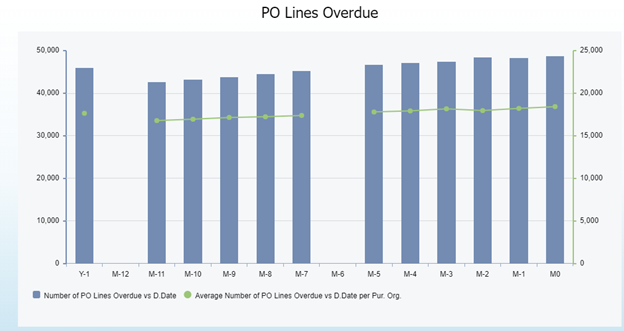
Figure 10 Trend number of PO lines overdue vs. delivery date
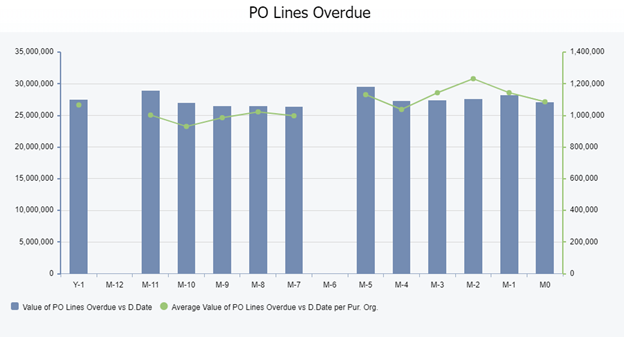
Figure 11 Trend value of PO lines overdue vs. delivery date
Strategic dashboards, otherwise known as scorecards
Scorecards emphasize management, rather than monitoring or analysis. Executive teams use the scorecard to see the progress and trends on performance management and review the plans for future organizational strategic plans.
Example of scorecards in action
A prominently used scorecard at one supply chain company is shown in Figure 12 and helps the company’s supply chain executives monitor on-time delivery (OTD) in terms of percentage and trends and to identify the top 10 product groups and suppliers.
The OTD% composite is the average between OTD% per receipt and OTD% per value. This is a balanced measurement which is impacted by the number of receipts, the quantity and the price of the parts received.
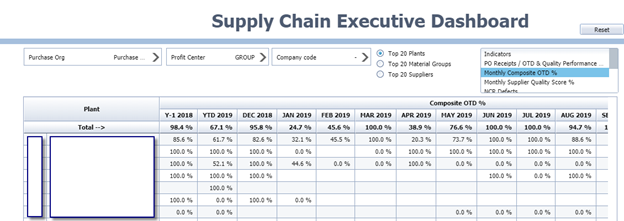
Figure 12 Strategic dashboard – supply chain executive dashboard
Note: It is recommended that you view scorecards in a chart format by default and review the summary data when needed to further analyze data.
Operations executives at the company use a plant operations scorecard to review cost, delivery, and cash flow trends for both monthly and quarterly periods (Figure 13). Be very careful what you include:
- Things should not be measured just because they are easy to analyze
- Things should be measured because they are important
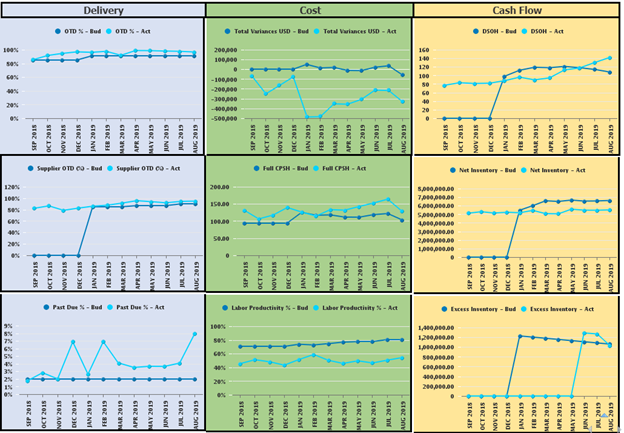
Figure 13 Example of plant operations scorecard to review cost, delivery, and cash flow trends
In Figure 13, detailed data is stored in a Data Store Object (DSO) and rolled up into Info Cubes for analysis. You can use even more summarized cubes for your KPIs. Query performance on dashboards are critical to your success.
Note: IT does not own KPIs. Make sure you have a change control board and executive (not senior management), sponsorship.
Figures 14, 15 and 16 below, displays the tabular form of data supporting above charts from Figure 13.
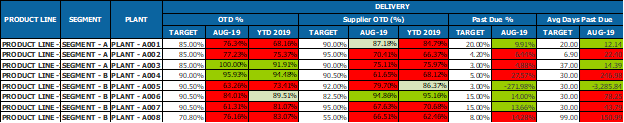
Figure 14 Tabular data behind the delivery trends
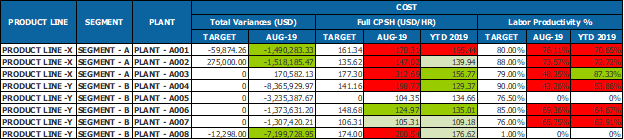
Figure 15 Tabular data behind the cost trends
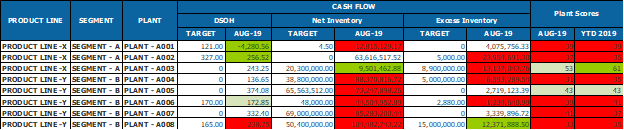
Figure 16 Tabular data behind the cash flow trends
What Does This Mean For SAPinsiders?
Information mentioned in this article is applicable to small-, medium- and large-sized organizations. Based on these guidelines, SAPinsiders should:
- Identify measures to drive competitive advantage. Do not measure something just because the data is easily available. Instead, the strategic objectives cascaded down to tactical and operational levels should be the drivers on what to measure because they are important to align the people–including front line workers–to the organizational goals.
- Review the level of details and stakeholders. Every person in an organization plays a vital role within their scope of work so it is important to provide required information to improve efficiency on incremental basis. Level of details differ for front line, mid-level and C-level teams so design the dashboard or scorecard to drive effective decision-making process on a regular basis.
- Use the tools to capture opportunities for improvement. Just as a doctor keeps track of the health records of patient, these dashboards and scorecards should be used as tools to understand past, current, and future trends of business processes to identify potential opportunities for improvement, such as kaizen events or six sigma projects. Results and trends should not be used to point out the inefficiencies
- Publish the reports to promote friendly competition. Successful organizations publish results and promote friendly competition by involving people at all levels with best performance awards or something equivalent to that, which should motivate the teams to achieve organizational goals. Never point out the underperforming teams. Instead, review the possibility of job rotations to get the best out of your employees.
- Validate the accuracy of the reports. It is very common that the formulas defined may be incorrect or trivial data points or exceptions change the aggregated reports. Involve your IT experts to find what kind of data points might be causing inaccurate reporting and handle those abnormal exceptions separately.