What’s Slowing Down Your BI Reports? Q&A on End-to-End Analysis of SAP BusinessObjects BI Performance with Johann Kottas
Thank you for joining our Q&A on analyzing performance issues in your BI reports and dashboards.

Xoomworks BI expert and consultant Johann Kottas took your questions and reviewed practical steps for analyzing and troubleshooting slowdowns in SAP BusinessObjects BI reporting.
Explore related questions
Johann shared detailed examples and posted his answers to readers’ questions on a variety of topics, covering tools such as Webi, SAP Design Studio, Xcelsius, and Analysis for Excel. You’ll also find screenshots from his examples in the chat session (just click on the images to view them in detail).
Review all the discussion in the chat replay, below, and the edited transcript.
SAPinsider: We’ll kick off our Q&A in just a few minutes. Today’s moderator is Bridget Kotelly, conference producer for BI 2015 US, Europe, and Singapore programs. Taking your questions today is BI expert Johann Kottas of Xoomworks, who will join us for the hour.
Bridget Kotelly: Welcome to today’s chat on getting to the root of performance issues in your SAP BI reports.
I’m joined today by Xoomworks’ Johann Kottas, who is here to take your questions for the hour. Johann is a principal consultant at Xoomworks with extensive BusinessObjects and BI experience focused on BI configuration, report design and optimization. Johann, welcome!
Johann Kottas: Hello Bridget, and thanks to all for joining.
Bridget Kotelly: Johann, before we get started on readers’ questions, could you start with an example of this approach – how you would take to assess time spent at each processing layer?
Johann Kottas: Let’s look at time spent per processing layer for a Web Intelligence refresh via OLAP BICS in BI 4.1 to HANA on BW.
It is vital that you first work out the different processing layers involved. Make use of the SAP Client plugin to launch a BOE session.
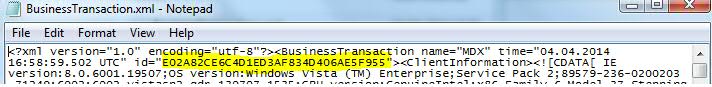
Activate the trace for the workflow you are analyzing. The business transaction ID (shown below) will get passed through the whole communication stack so you can clearly follow the function calls involved.
(For a more detailed view of all the screenshots Johann shared in the Q&A, click on the images in the chat replay, above.)
For a Web Intelligence refresh there will be an initial http servlet request from the client to your tomcat instance (you can find this thread in the BI Launchpad trace).
Next, depending on the nature of the content, the application server designed for this request will be called. In our scenario you will see an initial incoming call into Web Intelligence Processing Server.
Next you can follow the function call stack which will involve other services like:
- CMS (for security and core processing info)
- STS (to resolve SSO to DB, which in our scenario will be PSE trust in BW)
- DSL Bridge (DSL Outline service uses BICS layer of SAP engine to retrieve BEX queries ; transient unv)
Here is the BI Launchpad initial request from client, followed by the OUTGOING CALL:
![]()
(For a more detailed view of all the screenshots Johann shared in the Q&A, click on the images in the chat replay, above.)
And here is the same call from BI Launchpad, this time as the INCOMING CALL:
![]()
Brigit: Then Johann, once the trace is set up, how do you actually pinpoint where a slowdown is taking place?
Johann Kottas: Once you have an overview of the architectural workflow involved, you can determine the best method to capture where time is exactly spent during refresh execution.
First, take several measurements without any traces or transactions enabled. Once you get a steady measurement, work out next how much overhead the enabling of traces and/or transactions add to the total time.
For the scenario above:
- Use SAP Client plugin and set trace level to low
- Use httpWatch Basic to time your total execution and see the http requests involved and check the footprint of static content on your client
- Activate ST12 transaction on the user, but only capture RFC calls
After refresh:
- Collect BI Launchpad, WIPS, DSL Bridge, CMS, and STS traces
- Collect ST12 output
- Pick up statistics after refresh in ST13 / BIIPTOOLS
- Save the http watch output
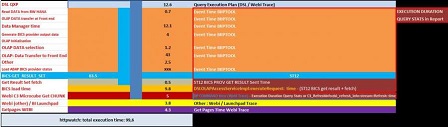
You can now merge and evaluate the time spend:
httpwatch: total execution time: xxxxx
- Webi : CMS time
- Webi: STS time (in case of SSO to BW)
- DSL QXP to BW: Create Query execution plan (BICS script) for data retrieval based on report design
- HANA in-memory DB operations: Check HANA DB retrieval times (direct dependency on data volumes)
- OLAP calculations (most calculations will be processed in OLAP, check possibility to push down to HANA)
- OLAP processing: Data is sorted and formatted according to query design
- BW BICS times: Receive data from OLAP processor and put into transfer structure in BICS interface
- Data transfer from BW to BI Layer
- DSL (Webi) BICS time: data transfer and preparation for Webi usage
- Webi processing: microcube population, report rendering
- Webi Get Pages generation
- Display in BI Launchpad and client rendering time
Johann Kottas: Once you have a verified example, you can set up a model based on function calls and query stats that will speed up this exercise and where you can cross-check the times.
Note that this model might change depending on the BOE version you running. For example, DSL Query Execution Plan time was part of the DP Command Ex total time at one point but is now not anymore, and will show as separate operation called getSessionInfosEx.
(For a more detailed view of all the screenshots Johann shared in the Q&A, click on the images in the chat replay, above.)
Bridget Kotelly: Following up from the previous question, how does the assessment change if you have, for example, a WebI refresh via JDBC on a HANA sidecar?
Johann Kottas: The same method can be applied however the fetch phase for JDBC happens by Web Intelligence Processing Server inproc. There is no outsourcing to connection server or DSL Bridge, but it’s done by CS JNI Engine inside WIPS.
So to capture the JNI call stack you will need to update the cs.cfg under /dataAccess/connectionServer
The output will be captured in the CSJNIEngine_trace file.
If SSO is used it will either be via SAML or Kerberos AD for JDBC and that time will show in the WIPS and STS output.
Bridget Kotelly: Johann, thanks for going through that in detail to start us off. With that, we’ll open it up to readers’ questions!
Comment From Tilak
When should we blame file store, CMS DB and Webi for performance problems in Webi reports? And what is the solution?
Johann Kottas: Hi Tilak, you can use the approach explained in the examples above: Find out first where you have a bottleneck or degradation.
It is not common that the retrieval action from file store is causing delay. CMS Infostore queries, however, can be grounds for concern. Find out which queries in particular are holding up your execution.
Solutions can be code optimization, increasing amount of parallel system DB connections and/or objects in cache, and also looking into DB tuning exercises.
Also look into other factors, like out-of-the-box monitoring that has a footprint on your CMS. We even witnessed a call outside the regular code path of the CMS causing a large instability on the whole platform.
For Web Intelligence processing, assess that you are sized and tuned appropriately. Take on an in-depth exercise to assess time spend per layer before making any conclusions.
Comment From iiro
I would be interested to know how to make Design Studio dashboards run faster when using BEx queries as a data source? Especially compared to Qlickview, performance times are poor in Design Studio 1.3 SP2.
Johann Kottas: For Design Studio content that is processed on the BOE stack, you will typically find the following areas in the processing stack:
- Session generation for Analysis Application Service (includes security calls/InfoStore & CMS time)
- Processing of Design Studio Report components :
- Validate security: CMS core server calls for authentication and security checks
- Set Template and retrieve report from File Repository
- Establish connection, i.e. JDBC or BICS
- Process command before rendering
- BICS script execution & data fetching
- Report processing – Analysis Application Service
- Content to be delivered back to client – Tomcat
- JavaScript and other static content processing and cache validation on client
Your design and number of Data Providers will ultimately determine your performance. If you have proof that the data fetching part is slow, assess the number of BICS conversations that are taking place and how long they take.
Run an RSTT trace and evaluate BW time.
Note that DPs are processed sequentially, which will all add up to your total time.
Also very important is to assess the footprint of static content and the Java scripts rendering.
Comment From Suraj
Dashboards question on UI components vs Excel functions: If I have 10 BEx query sources that need to be shown dynamically on user selection on a chart, is it better to have 10 charts that are dynamically displayed? Or one chart that reads from a spreadsheet array that is populated using vlookup of the 10 queries? And what about UI components vs. Excel logic?
Johann Kottas: Hi Suraj, vLookup should be avoided at all costs and will seriously impact performance. Dynamic visibility of multiple charts is the most straightforward solution. However, the BEx queries can be triggered as and when needed upon a condition, so you then have the best of both worlds by having a single chart (always best to use the least amount of components) and the data filled into the same spreadsheet space upon request. Performance will always be an issue in Xcelsius, so it is important to minimize the amount of data in the spreadsheet at runtime, the amount of components in the SWF file, and the number of data connections.
UI components should always be used over Excel logic for the performance reasons stated above, and whatever is put in the spreadsheet is at risk of data quality issues.
Comment From Alex Jeffries
What is the most effective way to improve the performance of opening a large pre-generated, pre-cached report instance, other than reducing the amount of data within the report?
Johann Kottas: Alex, I take it you are opening a scheduled report instance in native Webi format, where the Web Intelligence Processing Server has processed the report and uploaded the instance to the Output FRS?
Because the time for connectivity to the DB and micro cube population already took place, it will likely be the creation of the visual form of a Web Intelligence (.WID) document. This is managed by Report Engine, which will use the Report Specification (that is an XML flow) and a page range.
There is a dependency on data volume towards page generation but I would start looking at the report calculation.
Again for factual evidence, take a trace including display time on the client side (via http watch) and WIPS/BI Launchpad trace on low verbosity, and find out which component or layer is taking up most time.
Comment From Rajvinder
We have some data load that takes longer on the first day of week, especially when the data source is based on view, but it is fine during rest of week. Any suggestions?
Johann Kottas: Hi Rajvinder, I’m not entirely sure what you mean by data load. Are you talking about ETL or report refresh?
My guess would be that you have an ETL process running over the week and the “view” you talk about needs to be refreshed and all the calculations done on Monday and you are hitting the cached version the rest of the week.
Comment From andreia
Where should we start when a regularly scheduled report that never had an issue starts to fail frequently?
Johann Kottas: What message are you getting for the failure in the Instance Manager? That might give you an indication already during which part of scheduling process workflow the issue occurs.
There will be interaction between CMS, Job Server, Processing Server, Input FRS and Connection Server. If you see exception logging activated via BO_trace.ini, it’s worth going through the logs of the services just mentioned.
Comment From Ingrid Cole
Report performance is inconsistent, making it very difficult to analyze. Any suggestions?
Johann Kottas: Hi Ingrid, my suggestion is to start taking on the exercise (as explained in the examples at the start of the Q&A) to find out where time is exactly spent for several executions.
You can now compare the output between a fast and slow execution and check where the inconsistency occurs.
Comment From Saikat Das
How can we troubleshoot performance issues with WebI reports based on HANA sidecar via UNX universe?
Johann Kottas: Hi Saikat, see my first answers at the beginning of this Q&A and in my post to Ingrid. You can use the same approach.
Comment From Grant
Hi Johann, BusinessObjects publications sent to a fileserver in PDF format take way too much time! For 4,000 files, it can take 5 to 10 hours. How can we achieve improved throughput? FYI – the same WebI report refresh online (in the Launchpad) completes within 10 minutes.
Johann Kottas: Grant, a lot will depend on the publication setup, the report design/universe feeding the publication, content type, your server capacity and the setup and report bursting method used.
For example, I have witnessed a large overhead with one database fetch for all recipients as the bursting method.
With output in native Webi format, a lot of redundant data was delivered, which affected the footprint on the FRS as well as the overall job time, as the individual file size was big. The Webi microcube contained the data for all recipients, but the view was filtered out and displayed.
If you use this bursting method but the output is PDF (external format), then there would be no data security risk or any redundant data delivered.
I would require more context around your setup:
- How many reports are in the publication?
- Is it loading another report for dynamic recipient’s resolution?
- How many recipients?
- Which report bursting method is set?
- Are you running it for every user or are you using Profiles (Profiles would probably be far quicker than using user security in the DB/Universe)?
- How long does it take for the same report to be saved into PDF from BI Launchpad?
If you have evidence that it’s slow because of throughput to a remote network location, then it would be influenced by cluster and disc config.
For accurate evidence you can apply the same method described back in my examples at the start of the Q&A to trace this via Plugin and run the job manually from the CMC.
Comment From Kathrin
Is it possible to precalculate SAP BusinessObjects Analysis for Excel reports, similar to the instances for WebI reports? Or any other possibility for very fast report response time without HANA?
Johann Kottas: Kathrin, are you referring to SAP Analysis edition for MS Office?
In that case you will have to install Analysis BI platform Add-On. Once done, you can schedule Analysis workbooks in the BI Launch Pad and the Central Management Console.
Comment From Josef Sasek
Question on Design Studio data volume limitations: There is a limit of 50K records for data from the universe. Are there the same limitations for data from NetWeaver or HANA, and is it possible to change these limitations?
Johann Kottas: There should not be any limit for the result set of standard DS components. Extension components developed with SDK are limited with 10,000 cells.
SAP recommends keeping the number of cells below 10K for good performance.
Comment From Jennifer Schwarz
What do you suggest for BusinessObjects 4.1 based on MS SQL server (extracted data from SAP with Data Services, based on standard SAP RapidMarts)?
Johann Kottas: Hi Jennifer, if there is a specific issue it may differ, but in general, the traces that have been discussed using the client plugin will be a good start. Ensuring indexes are created, maintained and rebuilt on the SQL Server side through the DS job will also be of use.
Does the connection use SSO to SQL Server, or is it just using a hard coded user in the connection? The former will give fluctuations based on the user profile, but the latter should give a more standard performance.
Bridget Kotelly: Johann, we’re seeing a lot of questions about common performance holdups. Can you list some that are easily overlooked?
Johann Kottas: Initial concern is often lack of server resources; configuration or setup (distribution) matters. Those reservations certainly need verifying and in large enterprise systems with clustered CMS, the distribution of services is an important aspect, as is the heap assignment and configuration.
Those anxieties can be easily validated.
My suggestion is to start with analyzing a workflow in isolation to verify whether active concurrency is a factor in performance degradation.
Once you get a steady measurement, take the time to analyze all processing layers involved and work out how to capture time spend per layer.
Delays can appear from unexpected elements. Here are some examples:
– Exceptions thrown in the server function call stack can slow down CORBA communication and influence execution times:
For example, after upgrade, refresh times measured an additional 20 seconds for the same report and data retrieved. From the analysis of time spend per processing layer it showed that the transient universe generation was now taking 7 times longer. During the Query Execution Plan generation exceptions were thrown that wouldn’t show up for the end user but were delaying the execution. SAP addressed this matter and execution times were back in line.
– Footprint of static content:
For example, this is seen in workflows as Design Studio refresh, or BI Launchpad logon where loading of CSS style sheets , Java scripts and other content is taking a substantial amount of time.
Start with assessing the number of files and total size loaded on the client, and verify how long it takes. Long loading times could be network speed or latency driven. Tomcat compression will help on the initial load.
Theoretically the subsequent executions are retrieved from local cache, however that might not be actually the case. We have seen that although the static content is present on the client cache, it does get ignored at times, resulting in additional overhead. Also, even when it does load from local cache, for some static content it takes a long time, which could be due to cache validation.
A good way to assess this is to use Http Watch or Fiddler output combined with Process Explorer capture on IE. From http traffic you can see if there is a local delay. With Process Explorer it will show the time it takes to process this static content.
– SDK InfoStore call:
Some executions could be slowed down by one particular SDK InfoStore call. This can certainly be the case when having CMS with a high number of objects and a complex security group structure, combined with a heavy role membership from BW. It could be that CMS DB is slow to respond (check parallel connections and cached objects), but often in these cases a particular internal query requires code optimization.
– Activation of BICS profiling has performance impact on Analysis for OLAP workflows:
My advice would be to disable this in PRD and have it activated in non PRD environments.
– Misconfiguration of Maximum Member Selector Size in CMC:
This misconfiguration combined with cache limit parameter in MDAS properties could affect time to display members in Analysis for OLAP and have an negative impact on memory footprint of MDAS.
– Java child creation
In BI4 a Java child is created for each job and can run only one job at a time. This product change was introduced for better reliability (a crashed or hung job in one process would not affect a job in another process), less conflict between jobs on resources within the same process, and accessibility of a greater range of Java heap space for each job. This change, however, introduced an extra overhead and affected the creation time of the java child process.
Comment From Tilak
Can we do a parallel processing of BEx queries on the BW side if my Webi report is using multiple BEx queries, so that the performance will increase?
Johann Kottas: It’s not driven by BW but by the reporting application. Webi does execute all calls to BW serially, even the grouping sets.
Comment From Guest
Question on WebI using hierarchies from BEx queries: Let’s say I have a hierarchy characteristic in my BEx query. In the query panel, I choose to display specific levels of the hierarchy in the report. This drastically slows down the report. When no levels are specifically chosen, the report is much faster. I might be wrong, but shouldn’t the data retrieval be faster in the former case?
Johann Kottas: Most probably different BICS calls to BW are used to get the whole hierarchy or particular level (nodes) of this hierarchy. In the second case there could be many small calls causing a performance issue. You can investigate it by collecting ST12/RSTT traces and check SAP notes looking for optimizations related to particular BICS calls.
Comment From Roger Caloni
Hi Johann, The company I work for recently upgraded from SAP BusinessObjects XI 3.1 to SAP BusinessObjects BI 4.1 version. We are still using Universe Design Tool (.unv) for our universes. I would like to ask you what are the compelling reasons to move the universes to Information Design Tool (.unx)? From a back-end perspective using UNX based queries consume more resources, which could affect performance, I believe.
Johann Kottas: Hi Roger, which DB are you using?
Comment From Roger Caloni: We’re using mostly Oracle databases.
Johann Kottas: To be honest the benefits in moving when using more traditional relational data sources aren’t as great… using UNX will push your query to the DSL Bridge stack, which allows you to use the Java parameters on the DSL bridge to tune it. But other than that I don’t see a huge benefit (unless you would like to create a UNX from multiple sources).
Comment From laura
Hi Johann, For my Dashboard tool application, the BI Launchpad takes too much time to open – not less than 45 seconds, sometimes even 1 minute. How can we optimize the opening of dashboards?
Johann Kottas: Hi Laura, if backend processing I suggest starting with analysis of the footprint and processing on the local client. You can use httpwatch Basic for the initial view.
Comment From Guest
How can we capture the runtime breakup of a scheduled Webi Report?
Johann Kottas: You can use the same method as explained in my example at the start of the Q&A, and use the plugin from the CMC to run the job as now. Or you set traces on low for the services involved via the CMC. But this could cause a large overhead if you have a heavy job schedule.
Comment From Rick
Can you speak to how much overhead is added when executing a report via BW over HANA versus a direct query against HANA? Let’s say the BEx query would be very simple in terms of exception aggregation and unit of measure conversions, etc., but heavy in terms of objects used and high record volume. Is the overhead significant?
Johann Kottas: The impact from high data volumes will be comparable in both cases. In case of BW on HANA the most significant overhead comparing to direct reporting on HANA can come from BICS protocol and generation of Transient universe
Comment From Sanja
In Webi is it better for performance to use one complex dimension/measure or is it better to combine more simple dimensions/measures?
Johann Kottas: In general the further back you can push your calculations, the better. However it is best to test and compare both scenarios.
Comment From Tilak
What are the performance bottlenecks we can anticipate when using Production environment on VMs?
Johann Kottas: If all CPUs are dedicated then it should be similar to a physical server, aside from potentially having the disks on a share across the network
However, if CPUs are not dedicated I believe you’re not technically supported, plus you do not have the resources you think you might…
Comment From Tilak
How large we can specify our custom APS? For example, DSL APS: We have Webi reports which fetch 8 GB of data from BW. In this case, what’s the maximum size we can go up to for the DSL APS, subject to the condition that we have sufficient memory on the server?
Johann Kottas: It’s a 64 bit process, I would not go above 16GB (or else garbage collection will take too long).
Bridget Kotelly: Thanks everyone for joining today’s chat. We’re wrapping up today’s Q&A now, but for more on BI reporting, visit SAPinsider’s BI Channel.
And to Johann Kottas of Xoomworks, thank you for joining us today and sharing your advice and tips.
Johann Kottas: Thanks everyone for joining, you can contact me off line at BI@xoomworks.com.
Thank you for joining our Q&A on analyzing performance issues in your BI reports and dashboards.
Xoomworks BI expert and consultant Johann Kottas took your questions and reviewed practical steps for analyzing and troubleshooting slowdowns in SAP BusinessObjects BI reporting.
Johann shared detailed examples and posted his answers to readers’ questions on a variety of topics, covering tools such as Webi, SAP Design Studio, Xcelsius, and Analysis for Excel. You’ll also find screenshots from his examples in the chat session (just click on the images to view them in detail).
Review all the discussion in the chat replay, below, and the edited transcript.
SAPinsider: We’ll kick off our Q&A in just a few minutes. Today’s moderator is Bridget Kotelly, conference producer for BI 2015 US, Europe, and Singapore programs. Taking your questions today is BI expert Johann Kottas of Xoomworks, who will join us for the hour.
Bridget Kotelly: Welcome to today’s chat on getting to the root of performance issues in your SAP BI reports.
I’m joined today by Xoomworks’ Johann Kottas, who is here to take your questions for the hour. Johann is a principal consultant at Xoomworks with extensive BusinessObjects and BI experience focused on BI configuration, report design and optimization. Johann, welcome!
Johann Kottas: Hello Bridget, and thanks to all for joining.
Bridget Kotelly: Johann, before we get started on readers’ questions, could you start with an example of this approach – how you would take to assess time spent at each processing layer?
Johann Kottas: Let’s look at time spent per processing layer for a Web Intelligence refresh via OLAP BICS in BI 4.1 to HANA on BW.
It is vital that you first work out the different processing layers involved. Make use of the SAP Client plugin to launch a BOE session.
Activate the trace for the workflow you are analyzing. The business transaction ID (shown below) will get passed through the whole communication stack so you can clearly follow the function calls involved.
(For a more detailed view of all the screenshots Johann shared in the Q&A, click on the images in the chat replay, above.)
For a Web Intelligence refresh there will be an initial http servlet request from the client to your tomcat instance (you can find this thread in the BI Launchpad trace).
Next, depending on the nature of the content, the application server designed for this request will be called. In our scenario you will see an initial incoming call into Web Intelligence Processing Server.
Next you can follow the function call stack which will involve other services like:
- CMS (for security and core processing info)
- STS (to resolve SSO to DB, which in our scenario will be PSE trust in BW)
- DSL Bridge (DSL Outline service uses BICS layer of SAP engine to retrieve BEX queries ; transient unv)
Here is the BI Launchpad initial request from client, followed by the OUTGOING CALL:
![]()
(For a more detailed view of all the screenshots Johann shared in the Q&A, click on the images in the chat replay, above.)
And here is the same call from BI Launchpad, this time as the INCOMING CALL:
![]()
Brigit: Then Johann, once the trace is set up, how do you actually pinpoint where a slowdown is taking place?
Johann Kottas: Once you have an overview of the architectural workflow involved, you can determine the best method to capture where time is exactly spent during refresh execution.
First, take several measurements without any traces or transactions enabled. Once you get a steady measurement, work out next how much overhead the enabling of traces and/or transactions add to the total time.
For the scenario above:
- Use SAP Client plugin and set trace level to low
- Use httpWatch Basic to time your total execution and see the http requests involved and check the footprint of static content on your client
- Activate ST12 transaction on the user, but only capture RFC calls
After refresh:
- Collect BI Launchpad, WIPS, DSL Bridge, CMS, and STS traces
- Collect ST12 output
- Pick up statistics after refresh in ST13 / BIIPTOOLS
- Save the http watch output
You can now merge and evaluate the time spend:
httpwatch: total execution time: xxxxx
- Webi : CMS time
- Webi: STS time (in case of SSO to BW)
- DSL QXP to BW: Create Query execution plan (BICS script) for data retrieval based on report design
- HANA in-memory DB operations: Check HANA DB retrieval times (direct dependency on data volumes)
- OLAP calculations (most calculations will be processed in OLAP, check possibility to push down to HANA)
- OLAP processing: Data is sorted and formatted according to query design
- BW BICS times: Receive data from OLAP processor and put into transfer structure in BICS interface
- Data transfer from BW to BI Layer
- DSL (Webi) BICS time: data transfer and preparation for Webi usage
- Webi processing: microcube population, report rendering
- Webi Get Pages generation
- Display in BI Launchpad and client rendering time
Johann Kottas: Once you have a verified example, you can set up a model based on function calls and query stats that will speed up this exercise and where you can cross-check the times.
Note that this model might change depending on the BOE version you running. For example, DSL Query Execution Plan time was part of the DP Command Ex total time at one point but is now not anymore, and will show as separate operation called getSessionInfosEx.
(For a more detailed view of all the screenshots Johann shared in the Q&A, click on the images in the chat replay, above.)
Bridget Kotelly: Following up from the previous question, how does the assessment change if you have, for example, a WebI refresh via JDBC on a HANA sidecar?
Johann Kottas: The same method can be applied however the fetch phase for JDBC happens by Web Intelligence Processing Server inproc. There is no outsourcing to connection server or DSL Bridge, but it’s done by CS JNI Engine inside WIPS.
So to capture the JNI call stack you will need to update the cs.cfg under /dataAccess/connectionServer
The output will be captured in the CSJNIEngine_trace file.
If SSO is used it will either be via SAML or Kerberos AD for JDBC and that time will show in the WIPS and STS output.
Bridget Kotelly: Johann, thanks for going through that in detail to start us off. With that, we’ll open it up to readers’ questions!
Comment From Tilak
When should we blame file store, CMS DB and Webi for performance problems in Webi reports? And what is the solution?
Johann Kottas: Hi Tilak, you can use the approach explained in the examples above: Find out first where you have a bottleneck or degradation.
It is not common that the retrieval action from file store is causing delay. CMS Infostore queries, however, can be grounds for concern. Find out which queries in particular are holding up your execution.
Solutions can be code optimization, increasing amount of parallel system DB connections and/or objects in cache, and also looking into DB tuning exercises.
Also look into other factors, like out-of-the-box monitoring that has a footprint on your CMS. We even witnessed a call outside the regular code path of the CMS causing a large instability on the whole platform.
For Web Intelligence processing, assess that you are sized and tuned appropriately. Take on an in-depth exercise to assess time spend per layer before making any conclusions.
Comment From iiro
I would be interested to know how to make Design Studio dashboards run faster when using BEx queries as a data source? Especially compared to Qlickview, performance times are poor in Design Studio 1.3 SP2.
Johann Kottas: For Design Studio content that is processed on the BOE stack, you will typically find the following areas in the processing stack:
- Session generation for Analysis Application Service (includes security calls/InfoStore & CMS time)
- Processing of Design Studio Report components :
- Validate security: CMS core server calls for authentication and security checks
- Set Template and retrieve report from File Repository
- Establish connection, i.e. JDBC or BICS
- Process command before rendering
- BICS script execution & data fetching
- Report processing – Analysis Application Service
- Content to be delivered back to client – Tomcat
- JavaScript and other static content processing and cache validation on client
Your design and number of Data Providers will ultimately determine your performance. If you have proof that the data fetching part is slow, assess the number of BICS conversations that are taking place and how long they take.
Run an RSTT trace and evaluate BW time.
Note that DPs are processed sequentially, which will all add up to your total time.
Also very important is to assess the footprint of static content and the Java scripts rendering.
Comment From Suraj
Dashboards question on UI components vs Excel functions: If I have 10 BEx query sources that need to be shown dynamically on user selection on a chart, is it better to have 10 charts that are dynamically displayed? Or one chart that reads from a spreadsheet array that is populated using vlookup of the 10 queries? And what about UI components vs. Excel logic?
Johann Kottas: Hi Suraj, vLookup should be avoided at all costs and will seriously impact performance. Dynamic visibility of multiple charts is the most straightforward solution. However, the BEx queries can be triggered as and when needed upon a condition, so you then have the best of both worlds by having a single chart (always best to use the least amount of components) and the data filled into the same spreadsheet space upon request. Performance will always be an issue in Xcelsius, so it is important to minimize the amount of data in the spreadsheet at runtime, the amount of components in the SWF file, and the number of data connections.
UI components should always be used over Excel logic for the performance reasons stated above, and whatever is put in the spreadsheet is at risk of data quality issues.
Comment From Alex Jeffries
What is the most effective way to improve the performance of opening a large pre-generated, pre-cached report instance, other than reducing the amount of data within the report?
Johann Kottas: Alex, I take it you are opening a scheduled report instance in native Webi format, where the Web Intelligence Processing Server has processed the report and uploaded the instance to the Output FRS?
Because the time for connectivity to the DB and micro cube population already took place, it will likely be the creation of the visual form of a Web Intelligence (.WID) document. This is managed by Report Engine, which will use the Report Specification (that is an XML flow) and a page range.
There is a dependency on data volume towards page generation but I would start looking at the report calculation.
Again for factual evidence, take a trace including display time on the client side (via http watch) and WIPS/BI Launchpad trace on low verbosity, and find out which component or layer is taking up most time.
Comment From Rajvinder
We have some data load that takes longer on the first day of week, especially when the data source is based on view, but it is fine during rest of week. Any suggestions?
Johann Kottas: Hi Rajvinder, I’m not entirely sure what you mean by data load. Are you talking about ETL or report refresh?
My guess would be that you have an ETL process running over the week and the “view” you talk about needs to be refreshed and all the calculations done on Monday and you are hitting the cached version the rest of the week.
Comment From andreia
Where should we start when a regularly scheduled report that never had an issue starts to fail frequently?
Johann Kottas: What message are you getting for the failure in the Instance Manager? That might give you an indication already during which part of scheduling process workflow the issue occurs.
There will be interaction between CMS, Job Server, Processing Server, Input FRS and Connection Server. If you see exception logging activated via BO_trace.ini, it’s worth going through the logs of the services just mentioned.
Comment From Ingrid Cole
Report performance is inconsistent, making it very difficult to analyze. Any suggestions?
Johann Kottas: Hi Ingrid, my suggestion is to start taking on the exercise (as explained in the examples at the start of the Q&A) to find out where time is exactly spent for several executions.
You can now compare the output between a fast and slow execution and check where the inconsistency occurs.
Comment From Saikat Das
How can we troubleshoot performance issues with WebI reports based on HANA sidecar via UNX universe?
Johann Kottas: Hi Saikat, see my first answers at the beginning of this Q&A and in my post to Ingrid. You can use the same approach.
Comment From Grant
Hi Johann, BusinessObjects publications sent to a fileserver in PDF format take way too much time! For 4,000 files, it can take 5 to 10 hours. How can we achieve improved throughput? FYI – the same WebI report refresh online (in the Launchpad) completes within 10 minutes.
Johann Kottas: Grant, a lot will depend on the publication setup, the report design/universe feeding the publication, content type, your server capacity and the setup and report bursting method used.
For example, I have witnessed a large overhead with one database fetch for all recipients as the bursting method.
With output in native Webi format, a lot of redundant data was delivered, which affected the footprint on the FRS as well as the overall job time, as the individual file size was big. The Webi microcube contained the data for all recipients, but the view was filtered out and displayed.
If you use this bursting method but the output is PDF (external format), then there would be no data security risk or any redundant data delivered.
I would require more context around your setup:
- How many reports are in the publication?
- Is it loading another report for dynamic recipient’s resolution?
- How many recipients?
- Which report bursting method is set?
- Are you running it for every user or are you using Profiles (Profiles would probably be far quicker than using user security in the DB/Universe)?
- How long does it take for the same report to be saved into PDF from BI Launchpad?
If you have evidence that it’s slow because of throughput to a remote network location, then it would be influenced by cluster and disc config.
For accurate evidence you can apply the same method described back in my examples at the start of the Q&A to trace this via Plugin and run the job manually from the CMC.
Comment From Kathrin
Is it possible to precalculate SAP BusinessObjects Analysis for Excel reports, similar to the instances for WebI reports? Or any other possibility for very fast report response time without HANA?
Johann Kottas: Kathrin, are you referring to SAP Analysis edition for MS Office?
In that case you will have to install Analysis BI platform Add-On. Once done, you can schedule Analysis workbooks in the BI Launch Pad and the Central Management Console.
Comment From Josef Sasek
Question on Design Studio data volume limitations: There is a limit of 50K records for data from the universe. Are there the same limitations for data from NetWeaver or HANA, and is it possible to change these limitations?
Johann Kottas: There should not be any limit for the result set of standard DS components. Extension components developed with SDK are limited with 10,000 cells.
SAP recommends keeping the number of cells below 10K for good performance.
Comment From Jennifer Schwarz
What do you suggest for BusinessObjects 4.1 based on MS SQL server (extracted data from SAP with Data Services, based on standard SAP RapidMarts)?
Johann Kottas: Hi Jennifer, if there is a specific issue it may differ, but in general, the traces that have been discussed using the client plugin will be a good start. Ensuring indexes are created, maintained and rebuilt on the SQL Server side through the DS job will also be of use.
Does the connection use SSO to SQL Server, or is it just using a hard coded user in the connection? The former will give fluctuations based on the user profile, but the latter should give a more standard performance.
Bridget Kotelly: Johann, we’re seeing a lot of questions about common performance holdups. Can you list some that are easily overlooked?
Johann Kottas: Initial concern is often lack of server resources; configuration or setup (distribution) matters. Those reservations certainly need verifying and in large enterprise systems with clustered CMS, the distribution of services is an important aspect, as is the heap assignment and configuration.
Those anxieties can be easily validated.
My suggestion is to start with analyzing a workflow in isolation to verify whether active concurrency is a factor in performance degradation.
Once you get a steady measurement, take the time to analyze all processing layers involved and work out how to capture time spend per layer.
Delays can appear from unexpected elements. Here are some examples:
– Exceptions thrown in the server function call stack can slow down CORBA communication and influence execution times:
For example, after upgrade, refresh times measured an additional 20 seconds for the same report and data retrieved. From the analysis of time spend per processing layer it showed that the transient universe generation was now taking 7 times longer. During the Query Execution Plan generation exceptions were thrown that wouldn’t show up for the end user but were delaying the execution. SAP addressed this matter and execution times were back in line.
– Footprint of static content:
For example, this is seen in workflows as Design Studio refresh, or BI Launchpad logon where loading of CSS style sheets , Java scripts and other content is taking a substantial amount of time.
Start with assessing the number of files and total size loaded on the client, and verify how long it takes. Long loading times could be network speed or latency driven. Tomcat compression will help on the initial load.
Theoretically the subsequent executions are retrieved from local cache, however that might not be actually the case. We have seen that although the static content is present on the client cache, it does get ignored at times, resulting in additional overhead. Also, even when it does load from local cache, for some static content it takes a long time, which could be due to cache validation.
A good way to assess this is to use Http Watch or Fiddler output combined with Process Explorer capture on IE. From http traffic you can see if there is a local delay. With Process Explorer it will show the time it takes to process this static content.
– SDK InfoStore call:
Some executions could be slowed down by one particular SDK InfoStore call. This can certainly be the case when having CMS with a high number of objects and a complex security group structure, combined with a heavy role membership from BW. It could be that CMS DB is slow to respond (check parallel connections and cached objects), but often in these cases a particular internal query requires code optimization.
– Activation of BICS profiling has performance impact on Analysis for OLAP workflows:
My advice would be to disable this in PRD and have it activated in non PRD environments.
– Misconfiguration of Maximum Member Selector Size in CMC:
This misconfiguration combined with cache limit parameter in MDAS properties could affect time to display members in Analysis for OLAP and have an negative impact on memory footprint of MDAS.
– Java child creation
In BI4 a Java child is created for each job and can run only one job at a time. This product change was introduced for better reliability (a crashed or hung job in one process would not affect a job in another process), less conflict between jobs on resources within the same process, and accessibility of a greater range of Java heap space for each job. This change, however, introduced an extra overhead and affected the creation time of the java child process.
Comment From Tilak
Can we do a parallel processing of BEx queries on the BW side if my Webi report is using multiple BEx queries, so that the performance will increase?
Johann Kottas: It’s not driven by BW but by the reporting application. Webi does execute all calls to BW serially, even the grouping sets.
Comment From Guest
Question on WebI using hierarchies from BEx queries: Let’s say I have a hierarchy characteristic in my BEx query. In the query panel, I choose to display specific levels of the hierarchy in the report. This drastically slows down the report. When no levels are specifically chosen, the report is much faster. I might be wrong, but shouldn’t the data retrieval be faster in the former case?
Johann Kottas: Most probably different BICS calls to BW are used to get the whole hierarchy or particular level (nodes) of this hierarchy. In the second case there could be many small calls causing a performance issue. You can investigate it by collecting ST12/RSTT traces and check SAP notes looking for optimizations related to particular BICS calls.
Comment From Roger Caloni
Hi Johann, The company I work for recently upgraded from SAP BusinessObjects XI 3.1 to SAP BusinessObjects BI 4.1 version. We are still using Universe Design Tool (.unv) for our universes. I would like to ask you what are the compelling reasons to move the universes to Information Design Tool (.unx)? From a back-end perspective using UNX based queries consume more resources, which could affect performance, I believe.
Johann Kottas: Hi Roger, which DB are you using?
Comment From Roger Caloni: We’re using mostly Oracle databases.
Johann Kottas: To be honest the benefits in moving when using more traditional relational data sources aren’t as great… using UNX will push your query to the DSL Bridge stack, which allows you to use the Java parameters on the DSL bridge to tune it. But other than that I don’t see a huge benefit (unless you would like to create a UNX from multiple sources).
Comment From laura
Hi Johann, For my Dashboard tool application, the BI Launchpad takes too much time to open – not less than 45 seconds, sometimes even 1 minute. How can we optimize the opening of dashboards?
Johann Kottas: Hi Laura, if backend processing I suggest starting with analysis of the footprint and processing on the local client. You can use httpwatch Basic for the initial view.
Comment From Guest
How can we capture the runtime breakup of a scheduled Webi Report?
Johann Kottas: You can use the same method as explained in my example at the start of the Q&A, and use the plugin from the CMC to run the job as now. Or you set traces on low for the services involved via the CMC. But this could cause a large overhead if you have a heavy job schedule.
Comment From Rick
Can you speak to how much overhead is added when executing a report via BW over HANA versus a direct query against HANA? Let’s say the BEx query would be very simple in terms of exception aggregation and unit of measure conversions, etc., but heavy in terms of objects used and high record volume. Is the overhead significant?
Johann Kottas: The impact from high data volumes will be comparable in both cases. In case of BW on HANA the most significant overhead comparing to direct reporting on HANA can come from BICS protocol and generation of Transient universe
Comment From Sanja
In Webi is it better for performance to use one complex dimension/measure or is it better to combine more simple dimensions/measures?
Johann Kottas: In general the further back you can push your calculations, the better. However it is best to test and compare both scenarios.
Comment From Tilak
What are the performance bottlenecks we can anticipate when using Production environment on VMs?
Johann Kottas: If all CPUs are dedicated then it should be similar to a physical server, aside from potentially having the disks on a share across the network
However, if CPUs are not dedicated I believe you’re not technically supported, plus you do not have the resources you think you might…
Comment From Tilak
How large we can specify our custom APS? For example, DSL APS: We have Webi reports which fetch 8 GB of data from BW. In this case, what’s the maximum size we can go up to for the DSL APS, subject to the condition that we have sufficient memory on the server?
Johann Kottas: It’s a 64 bit process, I would not go above 16GB (or else garbage collection will take too long).
Bridget Kotelly: Thanks everyone for joining today’s chat. We’re wrapping up today’s Q&A now, but for more on BI reporting, visit SAPinsider’s BI Channel.
And to Johann Kottas of Xoomworks, thank you for joining us today and sharing your advice and tips.
Johann Kottas: Thanks everyone for joining, you can contact me off line at BI@xoomworks.com.