Identifying Performance Problems in ABAP Applications
Analyze Statistics Records Using the Performance Monitor (Transaction STATS)
IT landscapes tend to become more complex over time as business needs evolve and new software solutions for meeting these needs emerge. This complexity can become a challenge for maintaining smooth-running business operations and for ensuring the performance and scalability of applications.
Performance means different things to different people. End users demand a reasonable response time1 when completing a task within a business process. IT administrators focus on achieving the required throughput while staying within their budget, and on ensuring scalability, so that a software’s resource consumption changes predictably with its load (the number of concurrent users or parallel jobs, or the number or size of processed business objects, for example). For management, optimal performance is about more productive employees and lower costs.
The overall objective is to reach the best compromise between these perspectives. This requires reliable application monitoring data, so that developers or operators can analyze an application’s response time and resource consumption, compare them with expectations, and identify potential problems. SAP customers running SAP NetWeaver Application Server (SAP NetWeaver AS) ABAP 7.4 or higher can access this data with a new, simple, user-friendly tool: the Performance Monitor (transaction STATS).
Explore related questions
This article provides an introduction to the statistics records that contain this monitoring data for applications that run on the ABAP stack, and explains how you can use transaction STATS to analyze these records and gain the insights you need to identify applications’ performance issues.
What Are Statistics Records?
Statistics records are logs of activities performed in SAP NetWeaver AS ABAP. During the execution of any task (such as a dialog step,2 a background job, or an update task) by a work process in an ABAP instance, the SAP kernel automatically collects header information to identify the task, and captures various measurements, such as the task’s response time and total memory consumption. When the task ends, the gathered data is combined into a corresponding statistics record. These records are stored chronologically — initially in a memory buffer shared by all work processes of SAP NetWeaver AS ABAP. When the buffer is full, its content is flushed to a file in the application server’s file system. The collection of these statistics records is a technical feature of the ABAP runtime environment and requires no manual effort during the development or operation of an application.
The measurements in these records provide useful insights into the performance and resource consumption of the application whose execution triggered the records’ capture, including how the response times of the associated tasks are distributed over the involved components, such as the database, ABAP processing (CPU), remote function calls (RFCs), or GUI communication. A detailed analysis of this information helps developers or operators determine the next steps in the application’s performance assessment (such as the use of additional analysis tools for more targeted investigation), and identify potential optimization approaches (tuning SQL statements or optimizing ABAP coding, for example). In addition to performance monitoring, the statistics records can be used to assess the system’s health, to evaluate load tests, and to provide the basis for benchmarks and sizing calculations.
Productive SAP systems process thousands of tasks each second and create a corresponding number of statistics records, which contain valuable measurements for identifying performance issues. While existing tools provide access to the data in these records, transaction STATS offers an enhanced user interface that makes it much easier for you to select, display, and evaluate the data in statistics records, and devise a targeted plan for optimization.
Ensuring the Validity of Your Measurements
The value of a performance analysis depends on the quality of the underlying measurements. While the collection of data into the statistics records is performed autonomously by the SAP kernel, some preparatory actions are needed to ensure that the captured information accurately reflects the performance of the application.
The test scenario to be executed by the application must be set up carefully; otherwise, the scenario will not adequately represent the application’s behavior in production and will not yield the insights you need to identify the application’s performance problems. A set of test data that is representative of your productive data must be available to execute the scenario in a way that resembles everyday use. The test system you will use for the measurements must be configured and customized correctly — for example, the hardware sizing must be sufficient and the software parameterization must be appropriate, so that the system can handle the load. To obtain reliable data, you must also ensure that the test system is not under high load from concurrently running processes — for example, users should coordinate their test activities to make sure there are no negative interferences during the test run.
You must then execute the scenario a few times in the test system to fill the buffers and caches of all the involved components, such as the database cache, the application server’s table buffer, and the web browser cache. Otherwise, the measurements in the statistics records will not be reproducible, and will be impaired by one-off effects that load data into these buffers and caches. This will make it much more difficult to draw reliable conclusions — for example, buffer loads trigger requests to the database that are significantly slower than getting the data out of the buffer, and that increase the amount of transferred data. After these initial runs, you can execute the measurement run, during which the SAP kernel writes the statistics records that you will use for the analysis.
Displaying the Statistics Records
To display the statistics records that belong to the measurement run, call transaction STATS.3 Its start screen (see Figure 1) consists of four areas, where you specify criteria for the subset of statistics records you want to view and analyze.

In the topmost area, you determine the Monitoring Interval. By default, it extends 10 minutes into the past and 1 minute into the future. Records written during this period of time are displayed if they fulfill the conditions specified in the other areas of the start screen. Adjust this interval based on the start and end times of the measurement run so that STATS shows as few unrelated records as possible.
In the Record Filter area, you define additional criteria that the records to be analyzed must meet — for example, client, user, or lower thresholds for measurement data, such as response time or memory consumption. Be as specific and restrictive as possible, so that only records relevant for your investigation will be displayed.
By default, statistics records are read from all application instances of the system. In the Configuration section, you can change this to the local instance, or to any subset of instances within the current system. Restricting the statistics records retrieval to the instance (or instances) where the application was executed shortens the runtime of STATS. The Include Statistics Records from Memory option is selected by default, so that STATS will also process records that have not yet been flushed from the memory buffer into the file system.
Under Display Layout, select the resource you want to focus on and how the associated subset of key performance indicators (KPIs) — that is, the captured data — will be arranged in the tabular display of statistics records. The Main KPIs layouts provide an initial overview that contains the most important data and is a good starting point.
Analyzing Selected Statistics Records
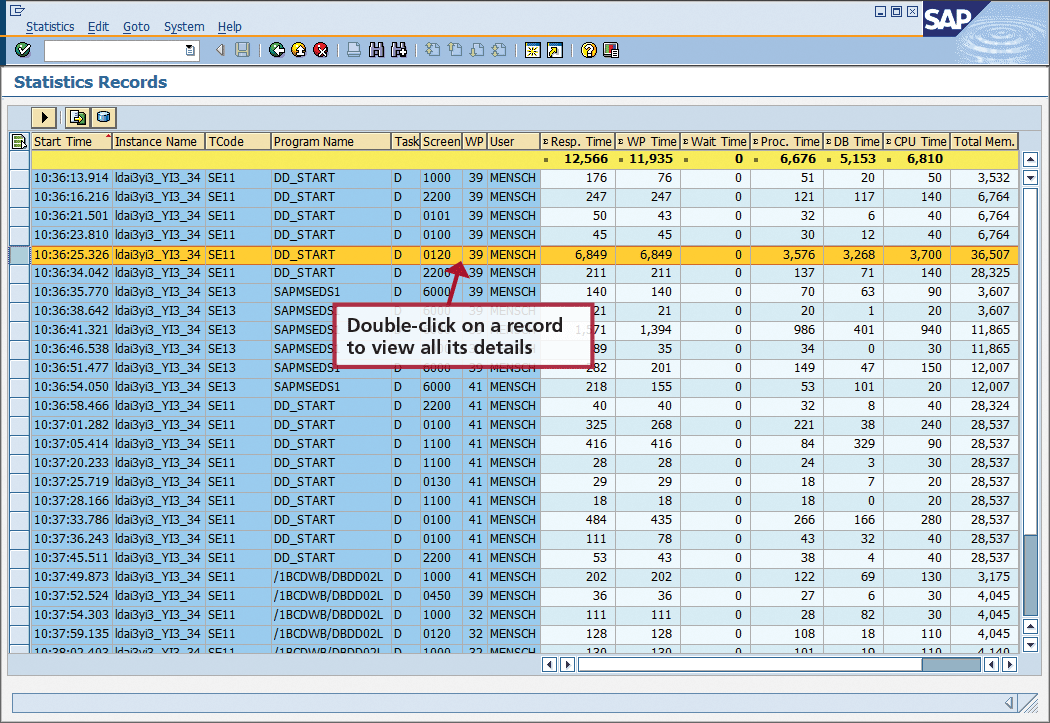
Figure 2 shows the statistics record display based on the settings specified in the STATS start screen. The table lists the selected statistics records in chronological order and contains their main KPIs.

The header columns — shown with a blue background — uniquely link each record to the corresponding task that was executed by the work process. The data columns contain the KPIs that indicate the performance and resource consumption of the tasks. Measurements for times are given in milliseconds (ms) and memory consumption and data transfer are measured in kilobytes (KB).4
The table of statistics records is displayed within an ALV grid control and inherits all functions of this well-known SAP GUI tool: You can sort or filter records; rearrange, include, or exclude columns; calculate totals and subtotals; or export the entire list. You can also switch to another display layout or modify the one you have chosen on the start screen. To access these and other standard functions, expand the toolbar by clicking on the Show Standard ALV Functions (![]() ) button.
) button.
The measurements most relevant for assessing performance and resource consumption are the task’s Response Time and Total Memory Consumption. The Response Time measurement starts on the application instance when the request enters the dispatcher queue and ends when the response is returned. It does not include navigation or rendering times on the front end, or network times for data transfers between the front end and the back end. It is strictly server Response Time; the end-to-end response time experienced by the application’s user may be significantly longer.5 The most important contributors to server Response Time are Processing Time (the time it takes for the task’s ABAP statements to be handled in the work process) and DB Request Time (the time that elapses while database requests triggered by the application are processed). In most cases, Total Memory Consumption is identical to the Extended Memory Consumption, but Roll Memory, Paging Memory, or Heap Memory may also contribute to the total.
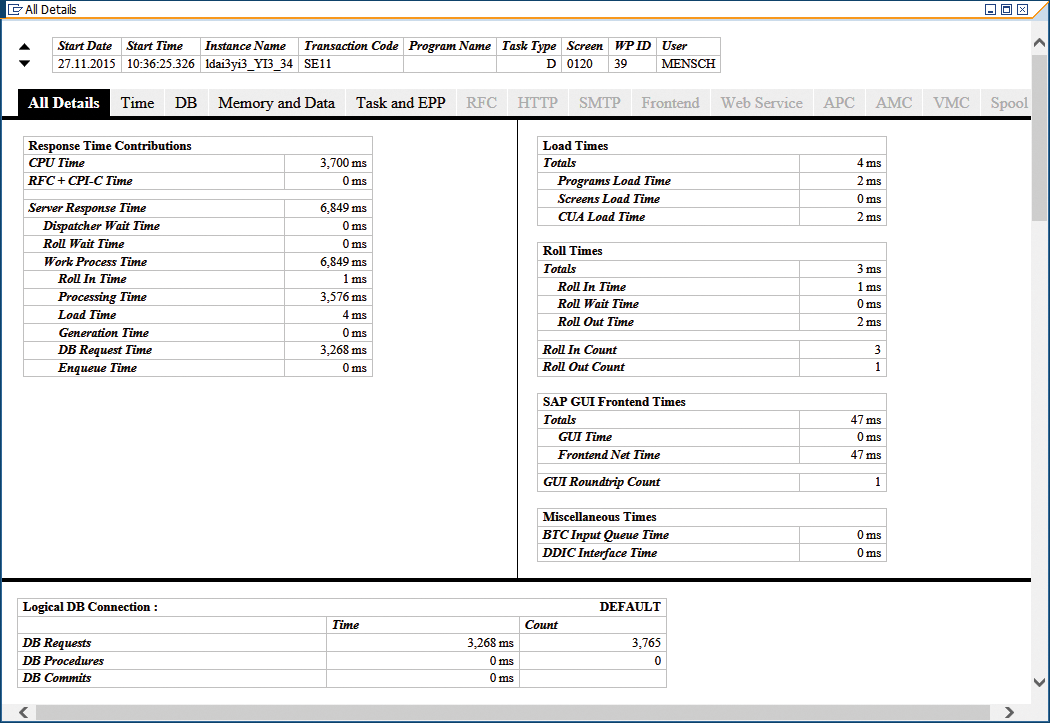
Since even the most basic statistics record contains too much data to include in a tabular display, STATS enables you to access all measurements — most notably the breakdowns of the total server Response Time and the DB Request Time, and the individual contributions to Total Memory Consumption — of a certain record by double-clicking on any of its columns. This leads to an itemized view of the record’s measurements in a pop-up window, as shown in Figure 3. At the top, it identifies the particular statistics record via its header data. The up and down triangles (![]() and
and ![]() ) to the left of the header data support record-to-record navigation within this pop-up. The available technical data is grouped into categories, such as Time, DB, and Memory and Data. Use the tabs to navigate between categories containing data. Tabs for categories without data for the current statistics record are inactive and grayed out.
) to the left of the header data support record-to-record navigation within this pop-up. The available technical data is grouped into categories, such as Time, DB, and Memory and Data. Use the tabs to navigate between categories containing data. Tabs for categories without data for the current statistics record are inactive and grayed out.

To assess the data captured in a statistics record, consider the purpose that the corresponding task serves. OLTP applications usually spend about one fourth of their server Response Time as DB Request Time and the remainder as Processing Time on the application server. For tasks that invoke synchronous RFCs or communication with SAP GUI controls on the front end, associated Roll Wait Time may also contribute significantly to server Response Time. For OLTP applications, the typical order of magnitude for Total Memory Consumption is 10,000 KB. Records that show significant upward deviations may indicate a performance problem in the application, and should be analyzed carefully using dedicated analysis tools such as transaction ST056 (Performance Trace). In comparison, OLAP applications usually create more load on the database (absolute as well as relative) and may consume more memory on the application server.
Saving Statistics
As mentioned earlier, productive systems create statistics records with a very high frequency, leading to a large volume of data that has to be stored in the application server’s file system. To limit the required storage space, the SAP kernel reorganizes statistics records that are older than the number of hours set by the profile parameter stat/max_files and aggregates them into a database table. After the reorganization, STATS can no longer display these records.
If you need to keep statistics — that is, a set of statistics records that match conditions specified on the STATS start screen — for a longer period of time for documentation reasons, reporting purposes, or before-after comparisons, you have two options:
- Export the statistics to a binary file on your front-end PC
- Save them into the statistics directory on the database
Both options are available via the corresponding ![]() and
and ![]() buttons, respectively, on the STATS start screen (Figure 1) and in the tabular display of the statistics records (Figure 2).
buttons, respectively, on the STATS start screen (Figure 1) and in the tabular display of the statistics records (Figure 2).
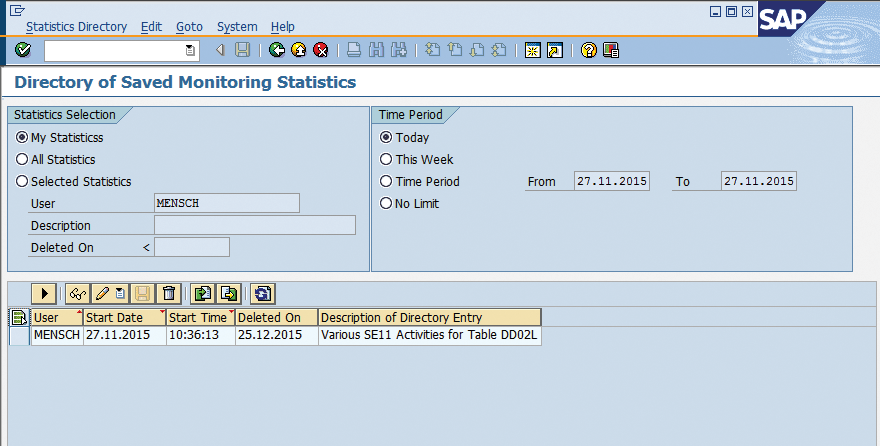
To access and manage the statistics that were saved on the database, click on the ![]() button on the STATS start screen (Figure 1), which takes you to the statistics directory shown in Figure 4. In the two areas at the top of the screen, you specify conditions that the statistics must fulfill to be included in the list displayed in the lower part of the screen. Statistics are deleted automatically from the database four weeks after they have been saved. You can adjust this default Deleted On date so that the data is still available when you need it. Similarly, you can change the description, which you specified when the statistics were saved. Double-clicking on a row in the directory displays the corresponding set of statistics records, as shown in Figure 2. All capabilities described previously are available.
button on the STATS start screen (Figure 1), which takes you to the statistics directory shown in Figure 4. In the two areas at the top of the screen, you specify conditions that the statistics must fulfill to be included in the list displayed in the lower part of the screen. Statistics are deleted automatically from the database four weeks after they have been saved. You can adjust this default Deleted On date so that the data is still available when you need it. Similarly, you can change the description, which you specified when the statistics were saved. Double-clicking on a row in the directory displays the corresponding set of statistics records, as shown in Figure 2. All capabilities described previously are available.

Statistics that were exported to the front-end PC can be imported either into the STATS start screen, which presents the content in the tabular display shown in Figure 2, or into the statistics directory, which persists it into the database. In both cases, the import function is accessed by clicking on the ![]() button. You can also import statistics into an SAP system that is different from the system where the statistics were exported. This enables the analysis of statistics originating from a system that is no longer accessible, or cross-system comparisons of two statistics.
button. You can also import statistics into an SAP system that is different from the system where the statistics were exported. This enables the analysis of statistics originating from a system that is no longer accessible, or cross-system comparisons of two statistics.
Conclusion
To optimize the performance of applications and ensure their linear scalability, you need reliable data that indicates the software’s response times and resource consumption. Within the ABAP stack of SAP solutions, this data is contained in the statistics records that the SAP kernel captures automatically for every task handled by a work process. Using this information, you can identify critical steps in an application, understand which component is the bottleneck, and determine the best approach for optimization.
The Performance Monitor (transaction STATS) is a new tool available with SAP NetWeaver 7.4 for selecting, displaying, and analyzing statistics records. It helps developers and operators find the best balance between fast response times, large data throughput, high concurrency, and low hardware cost. The tool is easy and convenient to use, and employs a feature-rich UI framework so that you can focus on the data and its interpretation, and set a course for high-performing applications.
1 “Reasonable” must always relate to the task’s role within the business process, never to its technical complexity. [back]
2 Every step of a transaction is recorded individually, which enables holistic analyses of applications, including the response times of each step and the user’s think times between steps. [back]
3 Development of transaction STATS is ongoing. This article presents the tool’s state in the development system for SAP NetWeaver 7.51 as of December 2015. [back]
4 One kilobyte equals 1,024 bytes. [back]
5 Other tools, depending on the type of front end, must be used to obtain information about these additional contributors to response time. [back]
6 See the article “Track Down the Root of Performance Problems with Transaction ST05” by Manfred Mensch in the July-September 2013 issue of SAPinsider (SAPinsiderOnline.com). [back]


