Dynamic Safety Stock Management: How to interpret MRP results of coverage profiles
by Venkata Ramana Nethi CSCP, CPIM, Business Process Lead – Operations, Schlumberger
Overview:
An organization’s strategic inventory policy and stocking strategies drive aggregate level inventory management (i.e., ABC/XYZ/LMN, etc. classification) which in turn drives item level inventory management. One of the most effective ways to perform item level inventory management on high volume and low complexity products is by using Dynamic Safety Stock coverage profiles on SAP material masters.
Explore related questions
Inventory specialists and planners are responsible for interpreting key fields related to coverage profile configurations and screens within the Dynamic Safety Stock solution, however most planners find it challenging to interpret Stock Requirements List (MD04) screen results.
Inventory specialists spend a significant amount of time performing continual reviews and updates on lot size and safety stock parameters at an SAP material master level, making the ability to interpret MD04 results an essential skill for aligning item level inventory management policies with business goals.
In this article you will learn how to:
- Set up Dynamic Safety Stock in SAP using coverage profiles
- Interpret the results generated by material requirements planning (MRP) on the material’s Stock Requirements List from an inventory manager or planner perspective
- Understand target vs. projected stocks of your products
- Use these results to make effective decisions in today’s competitive market
- Understand the key fields related to coverage profile configurations and screens to interpret results, which is a key activity performed by an inventory specialist or planner on a periodic basis
- Align item level inventory management policies to your organization
Business Scenario:
Organizations need to manage inventory effectively to meet fluctuation demand. Inventory may include products that are make-to-order (MTO) in nature or make-to-stock (MTS) in nature. Meeting demands is not a simple task due to fluctuations caused by a bull-whip effect (when forecasts yield supply chain inefficiencies) and market conditions. In either case using Dynamic Safety Stock in SAP provides an effective solution to address stockouts. Refer to the illustration shown in Figure 1.

Figure 1: Illustrative Example of Dynamic Safety Stock
A major challenge in many organizations is interpreting the results and using them in the decision-making process during review meetings. Coverage profiles look at forecasted demand to calculate an average daily requirement defined in the coverage profiles. Based on that average daily requirement, SAP will calculate a target safety stock level. By interpreting these results the inventory specialist or planner can adjust cover profiles as required.
Benefits:
- Eliminates manual review and maintenance of safety stocks.
- Provides automated safety stock calculation to achieve desired days of coverage.
Tips:
- It is important to maintain optimum inventory levels both when the demand is at its peak as well as when it is on the downward trend.
- Though MRP helps to match demand and supply to streamline the inventory, it does not consider fluctuations in demand and lead time.
- The SAP’s Dynamic Safety Stock solution helps build a buffer for the fluctuations, however a static safety stock value often delivers sub-optimal results.
- The Range of Coverage uses Dynamic Safety Stock calculation to adjust safety stock level with fluctuation in demand.
A. SAP Dynamic Safety Stock Example Calculation
Several inputs are required for SAP to calculate dynamic safety stock, as shown in Figure 2.
| Period Increments | # of Periods | # of Days Per Period | Target Range of Coverage |
| Buckets by which demand and PIReq’s will be divided | Number of periods SAP will look forward to calculate daily demand | Length of one period as defined in working days | Number of days targeted for coverage |
| Monthly | 5 | 20 (varies by month) | 15 |
Figure 2 – Business Inputs on a Set of Materials
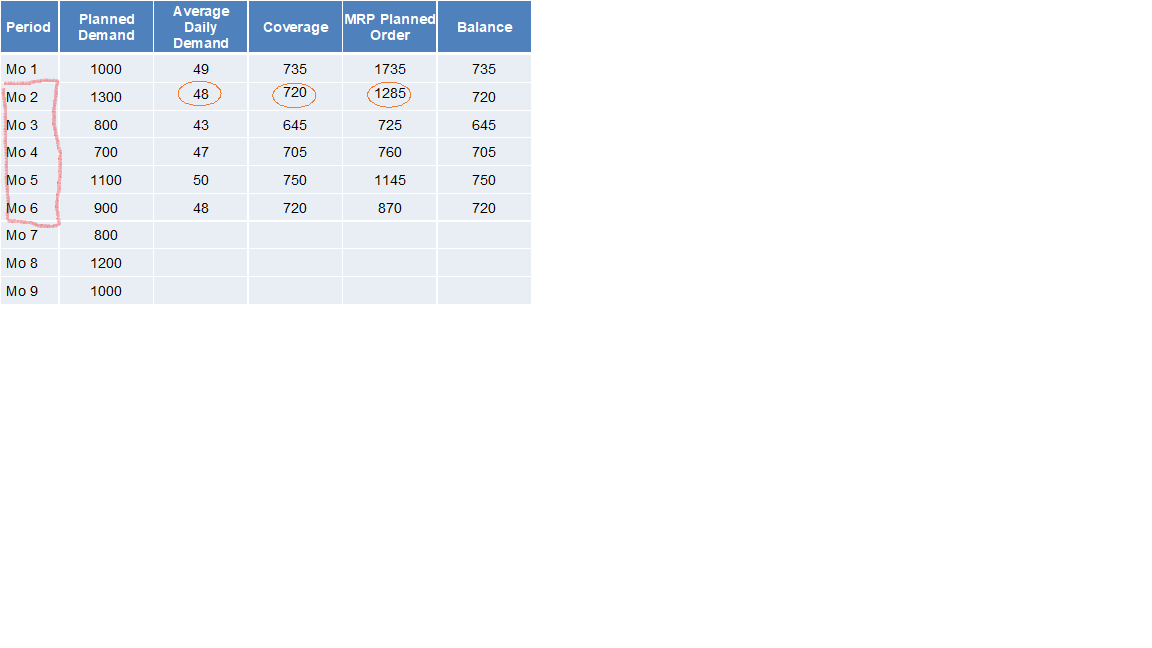
The following contains calculations of the results from Figure 2.
Average Daily Demand
Calculation = Total Demand over 5 periods / # Days per period
Example = (1300 + 800 + 700 + 1100 + 900) / (20*5) = 48
Coverage
Calculation = Average Daily Demand * Target Range of Coverage
Example = 48*15 = 720
MRP Proposal
MRP Proposal = Coverage + Demand – Balance
Example = 720 + 1300 – 735 = 1285
Figure 3 provides an example of MRP output.
B. SAP MRP – Range of Coverage Profile Configuration
Define range of coverage profiles in SAP configuration via transaction OMIA.
Figure 4 contains a screenshot of a range of coverage profile configuration.
Calculate Average Daily Requirement (highlighted in red rectangle in Figure 4):
- Average Daily Demand = Total Demand / # of Days
- The # of periods define the duration for total demand calculation
- The period indicator specifies the definition of the period (e.g. day, week, month, etc.)
- The period length specifies whether work days or calendar days will be used to calculate # of days
Base Dynamic Safety Stock Calculation on Range of Coverage in Days (highlighted in green rectangle in Figure 4):
- Dynamic Safety Stock = Average Daily Demand * Range of Coverage in Days
- The Target (Tgt.) defines the Dynamic Safety Stock coverage in days
- MRP will propose the inventory replenishment to achieve the target days of coverage based on average daily demand
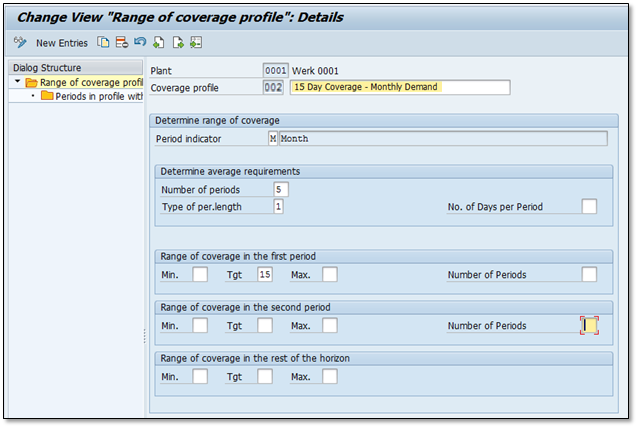
Figure 4 – Transaction OMIA: Range of Coverage Profile Configuration
Apply business rules into the configuration and your SAP Dynamic Safety Stock coverage
profile is ready to use on material master. You may create multiple profiles as required.
C. Setup Dynamic Safety Stock in MRP
In order to setup the Dynamic Safety Stock in MRP, the following MRP parameters must be
modified in the MRP2 screen:
- Assign the Coverage Profile via Transaction MM02 MRP2 view, as shown in Figure 5. Most of the planners find it challenging to understand the results generated by this profile. Section D discusses how to review and interpret the results.
Note: Safety Stock should be left blank if you are using the days of coverage profiles list shown in Figure 6.
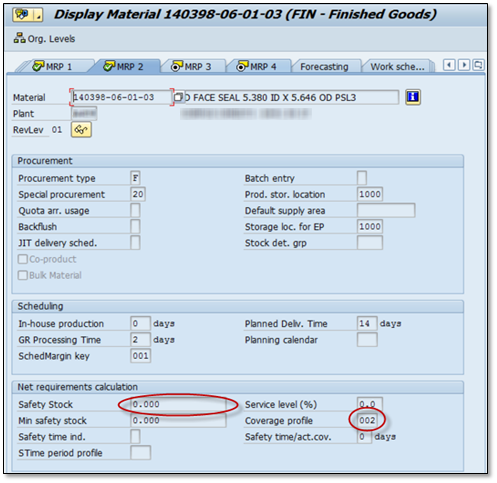
Figure 5 – Transaction MM02: Material Master MRP2 View

Figure 6 – Transaction MM02: List of Coverage Profiles, select which suit to the material
D. How to Interpret Results in MD04 to Monitor Planned Orders
MRP will automatically generate a targeted stock level based on demands, which can be either customer orders, planned independent requirements, dependent requirements, order reservations, or a combination of all these entered into the system.
Click icon ![]() (Switch to Period Totals) on the Stock Requirements List to monitor the planned orders. You should interpret the columns, as shown in Figure 7.
(Switch to Period Totals) on the Stock Requirements List to monitor the planned orders. You should interpret the columns, as shown in Figure 7.
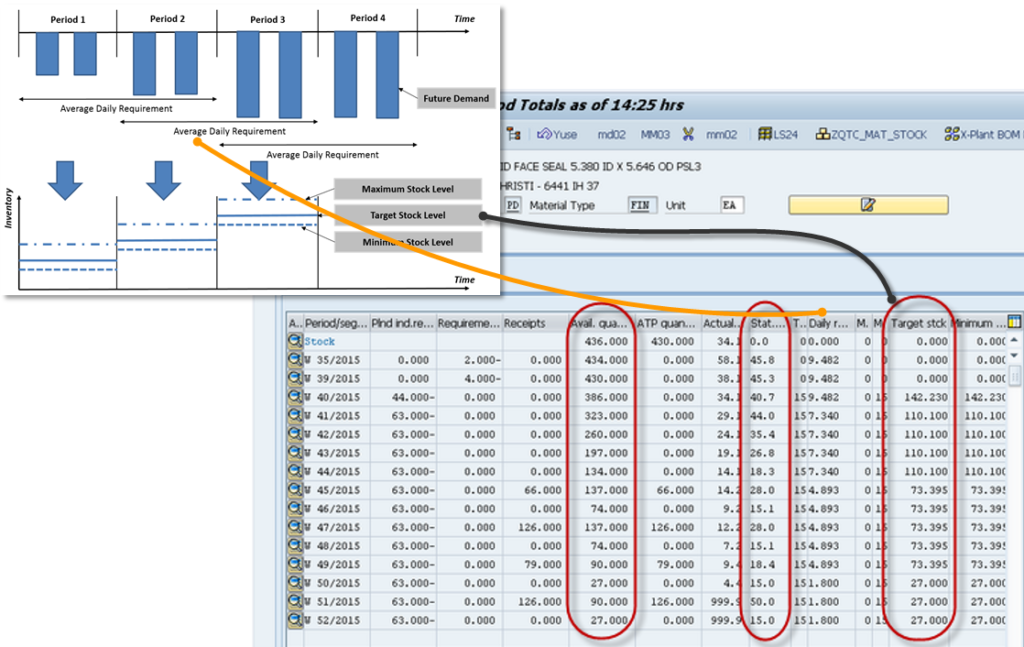
Figure 7 – Transaction MD04: View of ‘Switch to Period Totals’
It is recommended that you use ‘Planned Independent Requirements’ via MD61/MD62 transactions (also referred to as forecast) on the material and plant combination using coverage profiles to avoid stockouts.
Inventory specialists/planners should review the Actual Requirements, Receipts, and Available Inventory against the Planned Independent Requirements; then adjust accordingly on a weekly basis.
You should interpret results via Stock Requirements List (MD04), as show in Figure 8.


Figure 8 – Transaction MD04: View of ‘Switch to Period Totals’, business meaning
The outcome of the MRP results should assist planners in understanding Actual Coverage and Target Coverage projections, as shown in Figure 9.

Figure 9 – Transaction MD04: View of ‘Switch to Period Totals’, business meaning (cont.)
Now that you have gained a general understanding of how to interpret the results from SAP you can showcase your organization’s results in graphical format to assist in the decision-making process during inventory review meetings.
Figure 10 contains one such example where the detailed results generated by MRP using coverage profiles from MD04 are showcased in spreadsheets. These results can be interpreted by inventory specialists or planners, however MD04 is dynamic and constantly changing due to demand and supply fluctuations on day-to-day transactions.

Figure 10 – Example of Transaction MD04: View of ‘Switch to Period Totals’
Stable data is required to make effective decisions. You may download the data as shown in Figure 10 above, into spread sheets a day before your inventory meeting, or based on your planning cycle (Table 1).
| Week | Demand | Receipts | Project Stock | Target Stock |
| Wk 34 | 436 | |||
| Wk 35 | 2 | 0 | 434 | 0 |
| Wk 36 | 0 | 0 | 434 | 0 |
| Wk 37 | 0 | 0 | 434 | 0 |
| Wk 38 | 0 | 0 | 434 | 0 |
| Wk 39 | 4 | 0 | 430 | 0 |
| Wk 40 | 44 | 0 | 386 | 142 |
| Wk 41 | 63 | 0 | 323 | 110 |
| Wk 42 | 63 | 0 | 260 | 110 |
| Wk 43 | 63 | 0 | 197 | 110 |
| Wk 44 | 63 | 0 | 134 | 110 |
| Wk 45 | 63 | 66 | 137 | 73 |
| Wk 46 | 63 | 0 | 74 | 73 |
| Wk 47 | 63 | 126 | 137 | 73 |
| Wk 48 | 63 | 0 | 74 | 73 |
| Wk 49 | 63 | 79 | 90 | 73 |
| Wk 50 | 63 | 0 | 27 | 27 |
| Wk 51 | 63 | 126 | 90 | 27 |
| Wk 52 | 63 | 0 | 27 | 27 |
Table 1 – Example of Downloaded Stable Data shown in Figure 10
Next, generate your graphical output to use in your decision-making process, as shown in Figure 11.
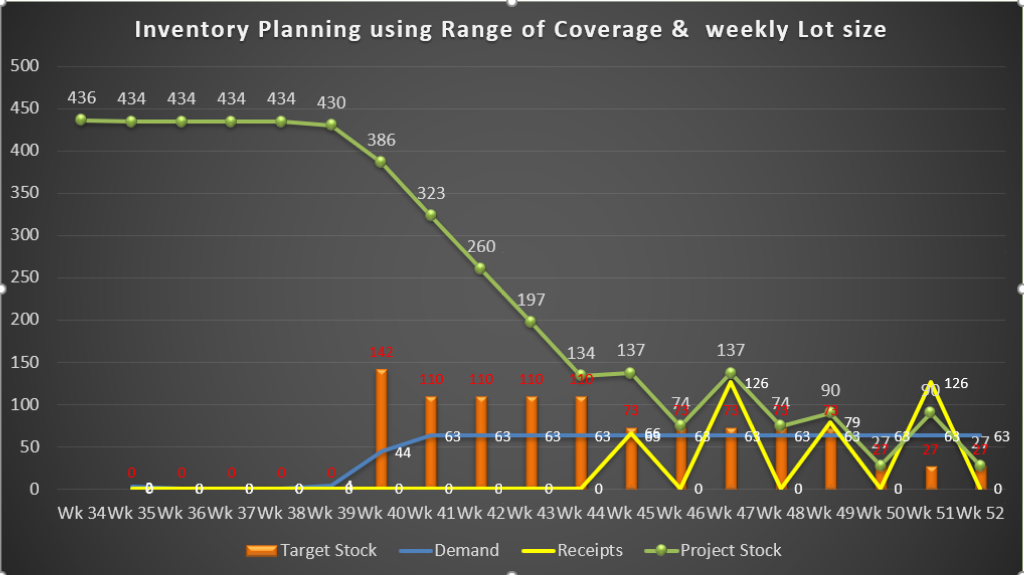
Figure 11 – Chart Representing Results From MRP Using Coverage Profiles, Data From Above Figure SAP Screen
Conclusion:
The objective of this blog is to showcase how you can set up your coverage profiles to suit your inventory policies in SAP. By effectively setting up a range of coverage profiles to suit your SAP inventory policies, your business will enjoy the following benefits:
- Enables inventory reduction and achieves project inventory balance as per the target stock based on coverage profile.
- Enables automated dynamic safety stock calculation to avoid stockouts.
- Aligns customer service levels by allowing you to review results on a periodic basis and update master data settings.
You may explore further to export the results of multiple materials from SAP MD04 to meet business specific inventory needs on high volume and low complexity materials; information mentioned here is applicable to small-, medium-, and large-sized organizations.