Learn how to use the Web Application Designer to create templates for interactive maps. By using only two settings, you can provide three levels of interactivity.
In "Set Up the BEx Map for Flawless Function in Five Easy Steps," I showed you how to set up the data for using the BEx Map.1 Now I'll describe how you can use a couple of settings within the Web Application Designer to create templates that allow maps to interact with various Web items (tables, graphics, etc.) within your Web template on three levels:
- Each Web item is autonomous and does not influence, nor is it influenced by, other Web items.
- Web items such as tables influence Web items such as maps or vice-versa (uni-directional).
- Maps and tables influence each other (bi-directional).
I have chosen this topic because customers often don't realize how much control they have when it comes to the interactiveness of their Web templates. This article will provide a concise guide to getting exactly the behavior you desire from your Web items, thereby shortening your testing time by minimizing “trial and error” when building your template. The trick to a successful Web template is to clearly understand how its settings cause the various Web items within it to affect each other.
You need a basic understanding of the Web Application Designer to follow along, as I've focused on two settings in the Web Application Designer: Map Interaction Controls and Affected Data Providers. They let you achieve the three different levels of interactivity.
Tip!
You can find all Web item settings by clicking on the object in your Web template and then clicking on the Web items tab in the Properties box. If working with a map, be sure to click on the appropriate map layer first, since each map layer can be configured individually.
I will show you how to set up your Web template for each of these three interactivity levels, but first let me tell you what the Map Interaction Controls setting is and how it works.
Map Interaction Controls
This setting determines if the map will influence other items in the Web template. It offers two options.
The most important option for this article, Click on Map to Filter Data Providers (see Figure 1), allows a user's navigation on the map to influence other Web items such as tables or charts. For example, say you are looking at a map of the United States, and below the map is a table that breaks down sales by state and product code. With the Click on Map to Filter Data Providers setting on, you can click on the state of California, and the query in the table below it will filter to show only the sales by product code for that state.
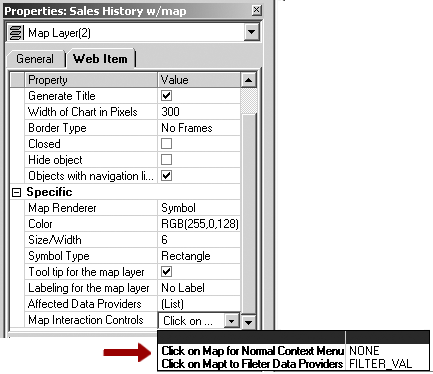
Figure 1
Enable the Click on Map to Filter Data Providers setting
Since you could have multiple items in the Web template, you might want the map to influence a table but not influence a chart or another Web item. Because of this, the Click on Map to Filter Data Providers option works in conjunction with the second of the two Web Application Designer settings mentioned earlier, Affected Data Providers, which I will describe in the next section.
The other option, Click on Map for Normal Context Menu (also shown in Figure 1), will not influence other items in the Web template.
Affected Data Providers
A Web template can have data coming in from a number of different sources; each source is mapped to a unique data provider within the Web template.
When dealing with a map, the Affected Data Providers setting (shown in Figure 2) works in conjunction with the Click on Map to Filter Data Providers setting. It allows you to specify exactly which data providers navigating on the map will influence. For example, say that you have a Web template with four Web items in it: the map (fed by data provider 1), a table (fed by data provider 2), a bar chart (also fed by data provider 2), and a pie chart (fed by data provider 3). You want the map to affect the bar chart and the table, but you do not want it to affect the pie chart. To accomplish this, you would use the Click on Map to Filter Data Providers setting in conjunction with the Affected Data Providers setting, where only data provider 2 is selected. Building on the California example from above, if the bar chart graphs sales by state and the pie chart graphs returns by state, then clicking on California would filter the bar chart to show only sales for California, while the pie chart would continue to show returns for all states.
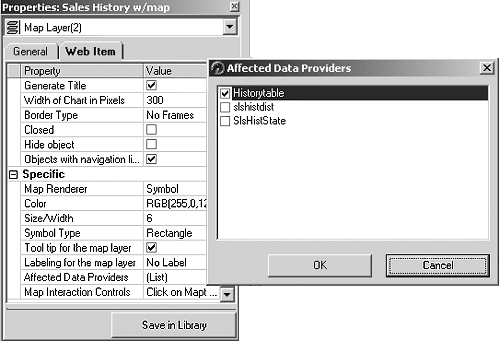
Figure 2
Check off the appropriate data providers
When dealing with Web items other than maps, the Affected Data Providers option works the same as described above. Since you are not dealing with a map, however, it does not require the Click on Map to Filter Data Providers setting. For example, take your California scenario and flip it around. If you drill down on your table to show, say, only values for California, then you want your map to show only figures for California. In this case, the Affected Data Providers setting will have data provider 1 selected (the data provider that feeds the map). The result of drilling down on the table will be:
- The map will be filtered to show only California data
- The bar chart will be filtered to show only California
- The pie chart will remain intact, showing all states
Note
The reason the bar chart is affected in the scenario above, even though its data provider (data provider 2) is not selected in the Affected Data Providers setting, is because it shares the same data provider as the table. If two Web items share the same data provider, then they automatically influence each other since they come from the same DataSource.
Settings Guide for the Three Levels of Interactivity
Now that you have an understanding of the two interactivity settings, you are ready to set up your Web template for the BEx Map. Here's what you need to do for each interactivity level:
Level 1. Each Web item is autonomous —it does not influence, nor is it influenced by, other Web items.
- Each Web item has a unique data provider.
- The Map Interaction Controls setting is set to option Click on Map for Normal Context Menu, and the Affected Data Providers setting does not have any data providers selected.
- The other Web items in the Web template have nothing selected for the Affected Data Providers setting.
Level 2. One Web item, such as a map, affects another Web item, such as a table, but the table does not influence the map (uni-directional).
Scenario 1: A table influences a map, but the map does not influence the table.
- Each Web item has a unique data provider.
- Select Click on Map for Normal Context Menu for the Map Interaction Controls setting.
- Make sure that the Affected Data Providers setting does not have any data providers selected. The data provider for other Web items such as a table feeds the map selected in the Affected Data Providers setting.
- Other Web items such as a table have the data provider that feeds the map selected in the Affected Data Providers setting.
Scenario 2: A map influences a table, but a table does not influence a map.
- Each Web item has a unique data provider.
- Select Click on Map to Filter Data Providers for the Map Interaction Controls setting.
- Make sure that the Affected Data Providers setting has the data provider for the table selected.
- Make sure that other Web items—such as another table—have no data providers selected in the Affected Data Providers setting.
Tip!
If you would like to influence the extent of geographic data that a map displays (in other words, only display countries for which there is data rather than display, say the entire continent of Europe), you can use the Extent of the Map setting. If, for example, you have data for Germany only, you would use the Data Only option. (See Figure 3.)
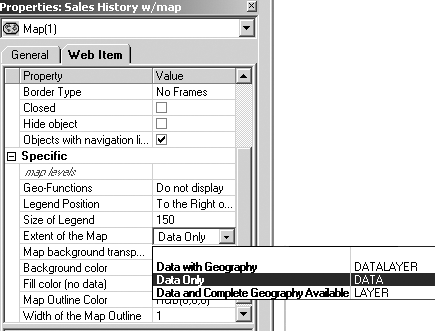
Figure 3
Select Data Only to tie the data drill-data to the map
Level 3. Maps and tables influence each other (bi-directional)
- All Web items share the same data provider.
- Select Click on Map to Filter Data Providers for the Map Interaction Controls setting.
- Select Click on Map to Filter Data Providers for the Map Interaction Controls setting.
- Choose the data provider for the table selected under the Affected Data Providers setting.
- For other Web items, such as another table, select the the data provider for the selected map in the Affected Data Providers setting.
You should now be able to set up the BEx Map for the Web with the interactions between map and data that you need.
1 To recap, the BEx Map is a part of the BEx Analyzer within Business Explorer that allows you to analyze geographic data. For example, you can evaluate customer data starting at a regional view and then drill down to a state, county, or city view if you wish. This aids users in the decision-making process by showing patterns and trends from a geographic perspective.
Lori Vanourek
Lori Vanourek started with SAP in 1996, after receiving her master’s degree in international business from the University of South Carolina, as a financial applications consultant focusing on the reporting and information analysis requirements of SAP’s customer base. She moved into the BW practice with its first release and has since specialized in the BW product, currently as a member of the BW product management team. Prior to joining SAP, Lori spent five years in the private sector as a financial analyst.
You may contact the author at lori.vanourek@sap.com.
If you have comments about this article or publication, or would like to submit an article idea, please contact the editor.